The Narin Gol River, an inland river flowing in the northwest of China, is renowned for its runoff volume and length. Yellow River Engineering Consulting Co., Ltd. ('YREC' in short) participated in the construction of the Narin Gol River Hydro-junction with its BIM+GIS platform integrating design and building on the basis of SuperMap GIS technology.
Based on B/S architecture, this project adopted WebGL plugin-free development method, realized the comprehensive management of engineering design and construction information on One Map GIS, and applied the multi-dimensional data analysis of horizontal multi-dimensional correlation and vertical deep mining.
The digital management system of Narin Gol River hydro-junction project during construction period possessed the following functions:
Progress management: check the real-time progress of each working face, including progress deviation and deviation rate; input the planned progress and actual progress into the network database, and use different colors in the graph area to represent, and associate them with the traditional horizontal graph data under the screen to make a comparison of progress deviation; propose the optimal crash plan to guarantee achieving scheduled goals through the automatic reminder and analysis of abnormal records.
Progress analysis: utilize construction boundary conditions and resources to calculate the planned time limit until it is finished, and then utilize virtual construction function to verify the scheme;
Quality assessment: it is mainly carried out on the mobile terminal, and associated with the model to view the assessment results and statistics on the computer terminal;
Change management: all change records and how related model changes can be examined in this platform;
Safety monitoring: the monitoring instrument model is combined with the monitoring data to display the monitoring results in various images.
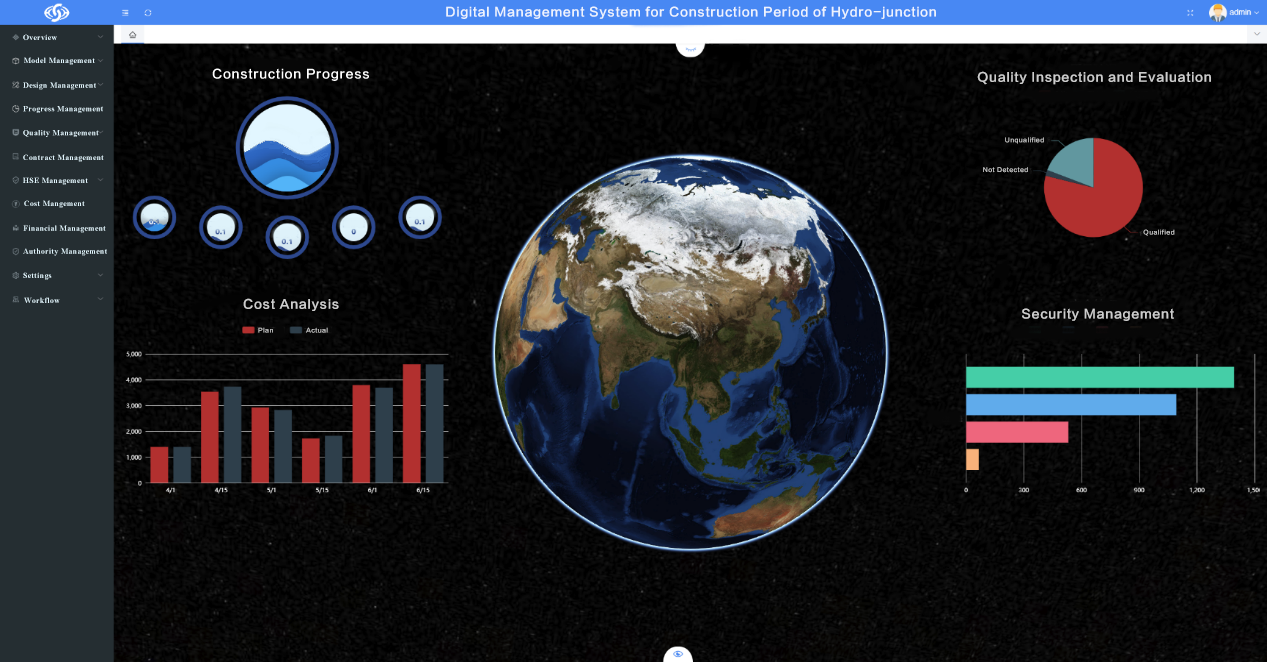
Figure 1: Data Cockpit
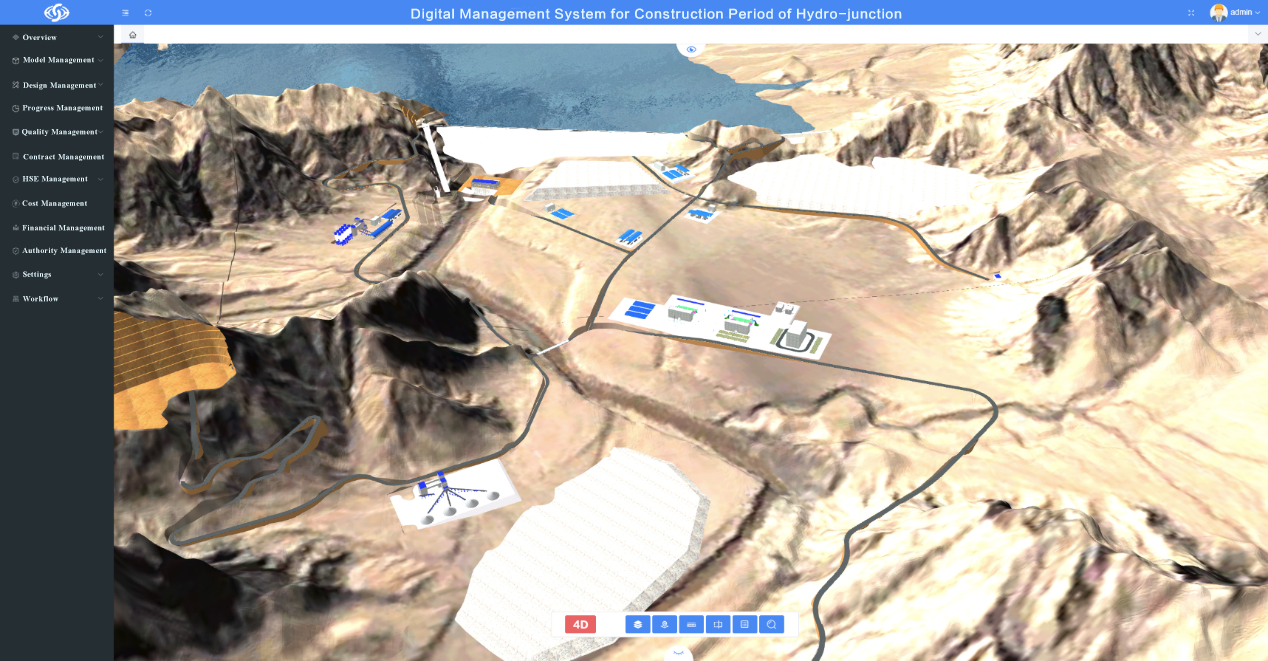
Figure 2: One Map
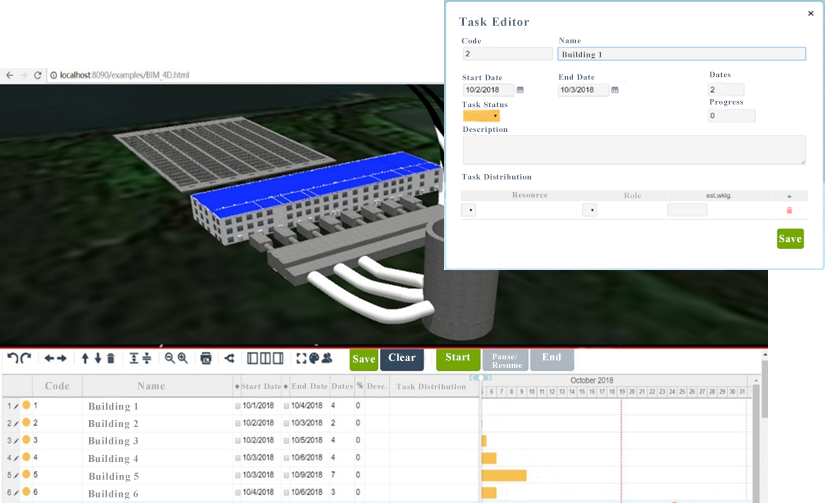
Figure 3: Progress Query
Effect: Through the integration of BIM+GIS technology, the original chart data mode is changed, and a visual model is provided. What is represented on the map can reflect the project progress more truly and specifically.