Based on Leaflet and SuperMap iClient JavaScript 10i (2020), an integrated green transport project of the GIS platform was developed. It was constructed through modern web technology stack. It integrated the leading open-source map library and visual charts. It provides a new display way of big data visualization and data flow functions and quickly by displaying all-round and multi-functional applications of public transport, taxis, online car-hailing on the Internet map with rich and diverse visualization charts. It has been proved a very useful tool in aiding decision-making, command and dispatch in the city’s traffic management.
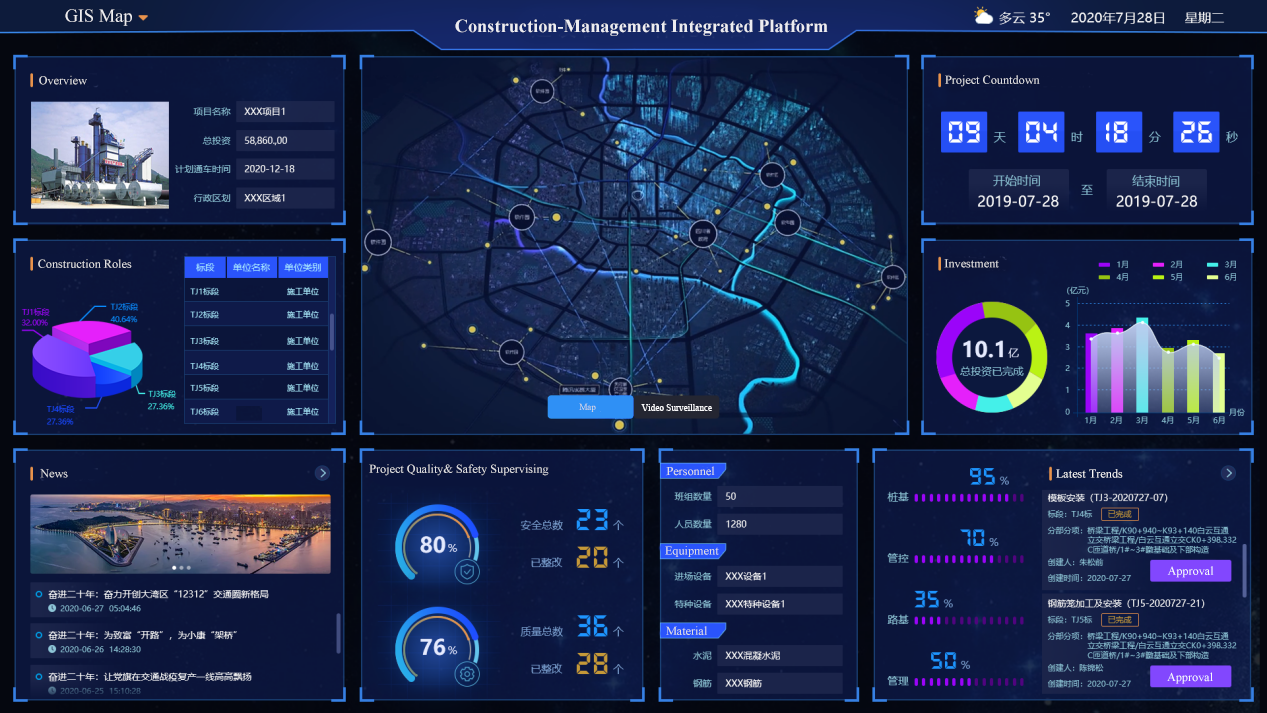
1. Visual display of project plans combined with existing data points
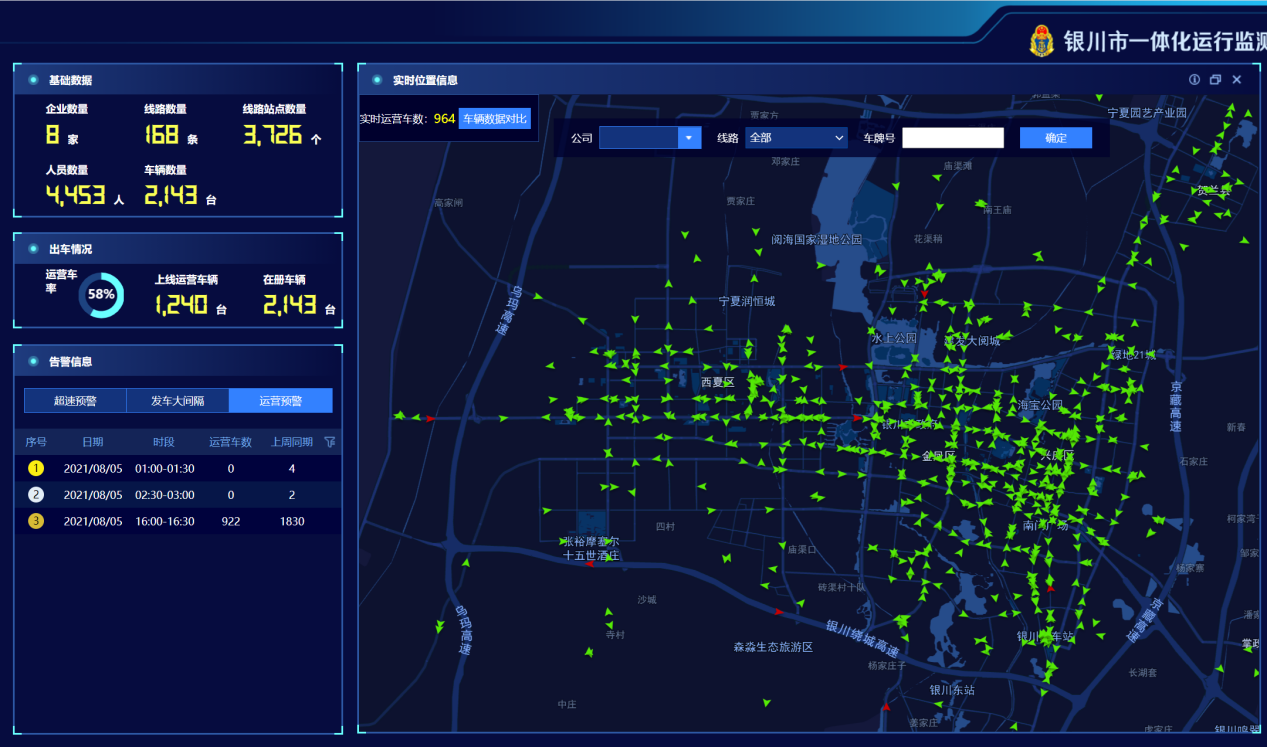
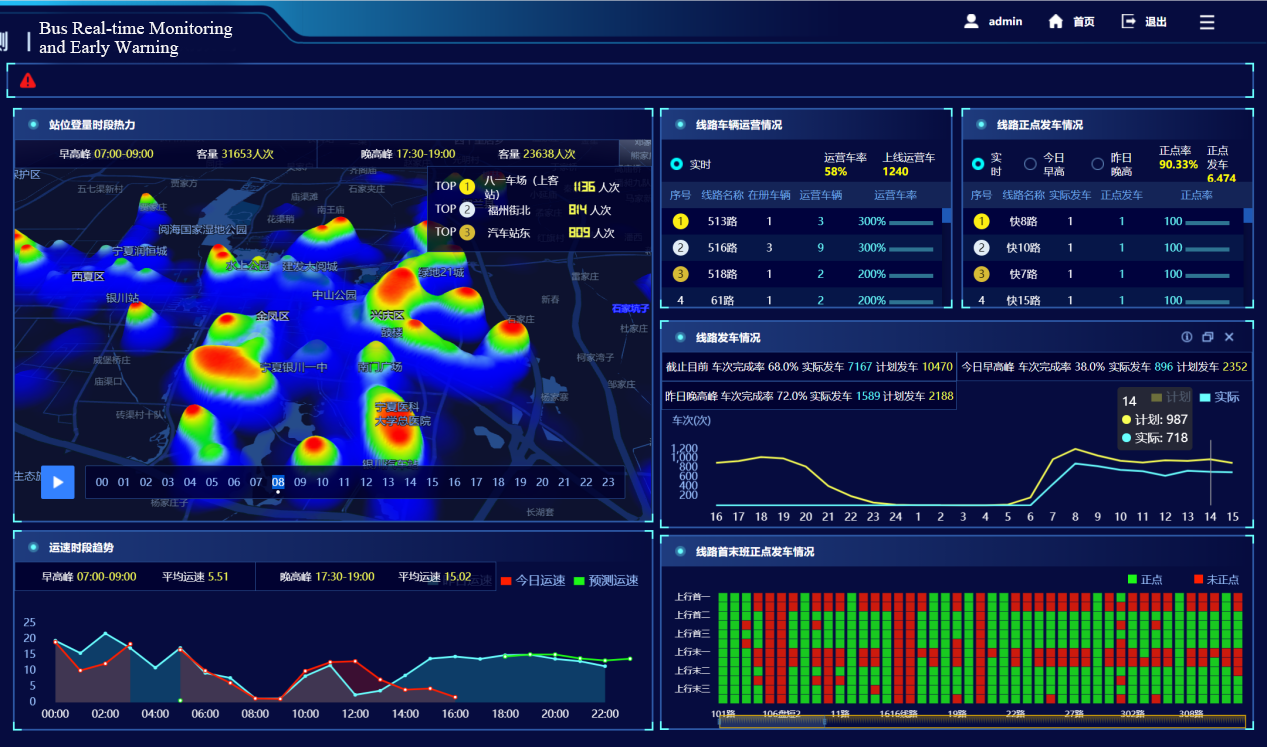
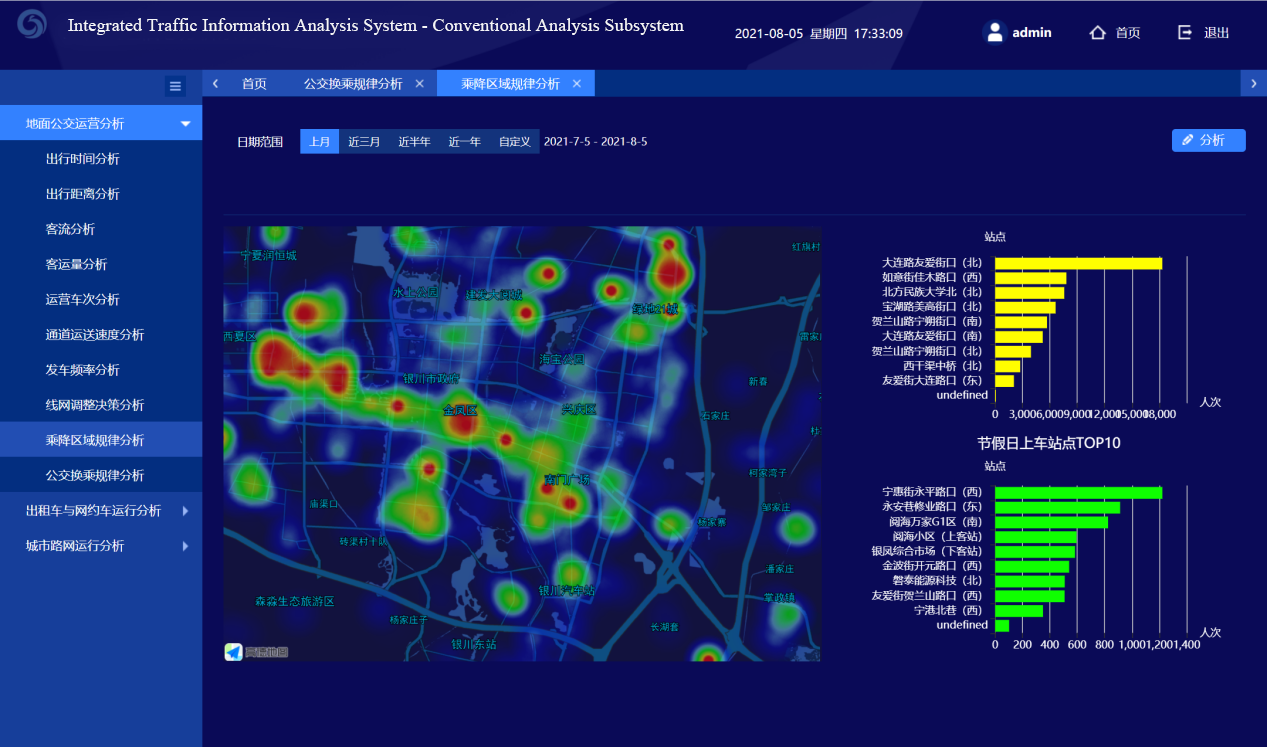
In the system, a large amount of point coordinate data is collected according to the real-time operation status of urban public transport. It displays the real-time monitoring status of public transport (heat map) under different conditions and the real-time bus operation status (heat map).

(2) Echarts Visual Chart display on the map
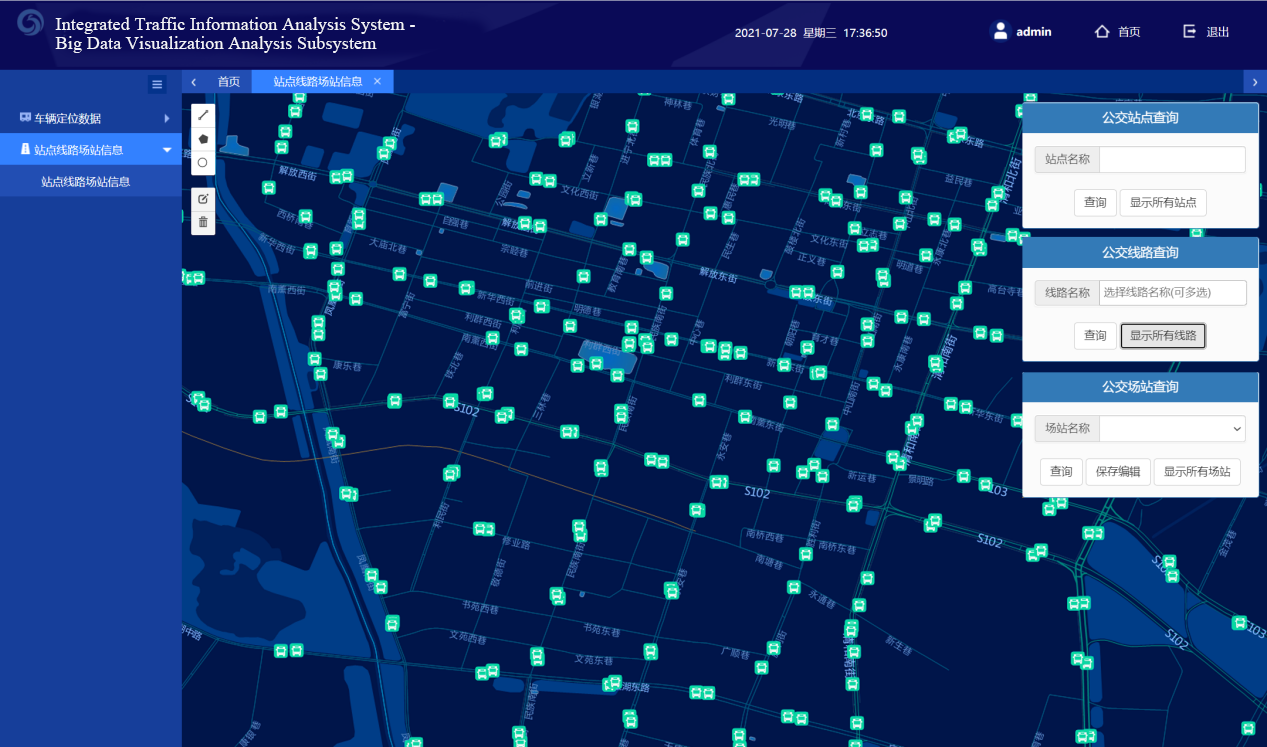
Distribution map of city bus stops (scatter plot), real-time bus distribution (scatter plot)