Pipeline data is the basic information of urban
construction and development. In the process of urban planning, designing,
construction and management, the complete and accurate pipeline information
is indispensable for the efficient works and scientific
management.
Based on 2D&3D integration technology, SuperMap provides
the 3D pipeline GIS application system with fast, efficient, complete and
practical technical solution which improves the performance of massive 3D
pipelines and provides a variety of practical 3D pipeline analysis functions.
Users can view the details of local pipelines and the macroscopic distribution
of regional pipelines, understand the single pipeline situation and the overall
distribution relationship of various pipelines, guide the engineering
construction and design the new district planning or pipeline at the same
time.
The traditional pipeline GIS system used
2D managements. While, the 2D technology cannot display the real pipeline space
distribution, material size, type and other information. So, in the information
expression, analysis and application of pipe network and pipeline data, the
3D management mode can better meet the needs and gradually replace the
2D system in pipeline management.
In considering that 2D GIS has
accumulated a large number of point and line data with business attributes,
SuperMap uses vector dotted data to build network datasets and realizes the
symbolic generation of the 3D pipeline automatically based on 2D&3D
integration technology. Also, it adaptively generates 3D
pipeline points according to network topology relationships to express the
features of elbows, tees, crosses and others, which can quickly build a
3D pipeline network scene to reduce the construction costs significantly. In
addition, SuperMap uses adaptive point symbol, instant rendering, LOD structure
and other technologies to improve the performance and provide a variety of
practical 3D pipeline analysis functions. In the rapid construction, mass
bearing and application analysis of 3D pipelines, SuperMap provides a fast,
efficient, complete and practical technical solution for the 3D pipeline GIS
application system.
Connectivity
Analysis
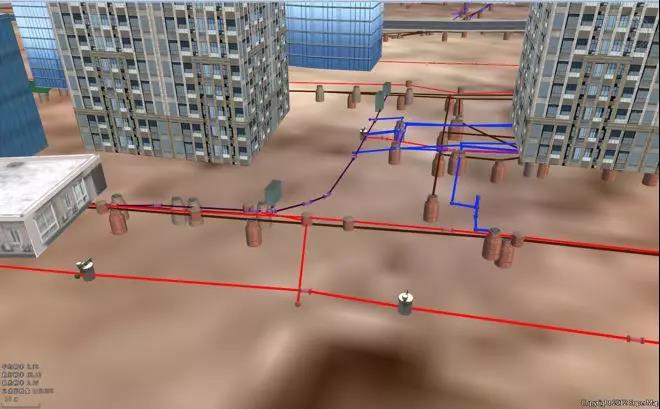
Connectivity analysis is an analysis of the connection
relationship between single pipeline and multiple pipelines. It can analyze the
location and the number of the pipeline connection, the flow direction, the flow
rate and the attributes of the pipeline, which helps to avoid and reduce the
contradictions and hidden dangers of underground facilities in the process of
municipal construction. It also improves the accuracy and scientificity of
pipeline engineering planning, design, construction and management, greatly
shortens the planning cycle, and effectively avoids and reduces the economic
loss caused by planning and design, routine maintenance and engineering rescue
command failure.
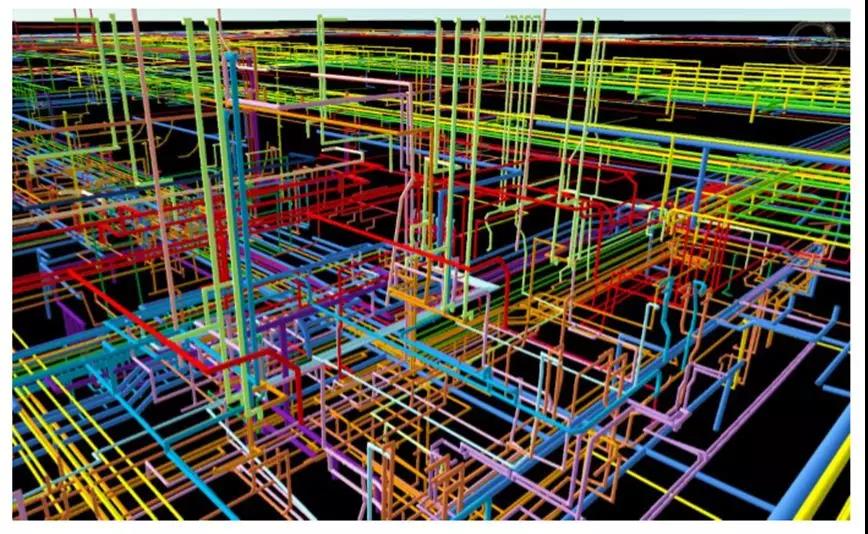
The Strong Data Carrying Capacity
In the scenes of
3D digital factory area and the municipal pipe network, there is large amount
of intricate and complex types of pipe network data on the ground and
underground that demands for the increasing carrying capacity of massive data.
SuperMap GIS provides four methods to improve the performance: 3D adaptive point
symbol, instant rendering technology, GPU computing and LOD
multi-detail technology. The comprehensive utilization of these technologies
ensures the superior rendering performance and stability of the platform. For
instance, in the following case, the pipeline data is huge and extremely dense,
there is pipeline data from about 600 kilometers pipelinein the range of 0.8
square kilometers. SuperMap solved the technical problems of rapid construction
of 3D pipeline data, the smooth loading of ultra-density pipelines, display and
management。
New 3D GIS Technology in Underground Water Management>
2D and 3D GIS in Natural Resources Management>
New 3D GIS Technology Supports the Construction of "Digital Twins" in Transportation>