The moon, is the celestial body that we are most familiar with, and the first extraterrestrial object ever landed by a human. With good weather, we can even see moon surface with details of depth and potholes. Through SuperMap iDesktop, a map of moon can be made to help us approach and get to know the moon much more.
Data download and import
The moon exploration project data release and information service system is the official moon exploration data platform in China: http://moon.bao.ac.cn/index.jsp. The website provides scientific data obtained by the Chang'e series of moon exploration satellites, moon samples and multimedia data, all of them can be downloaded for free after simple registration.
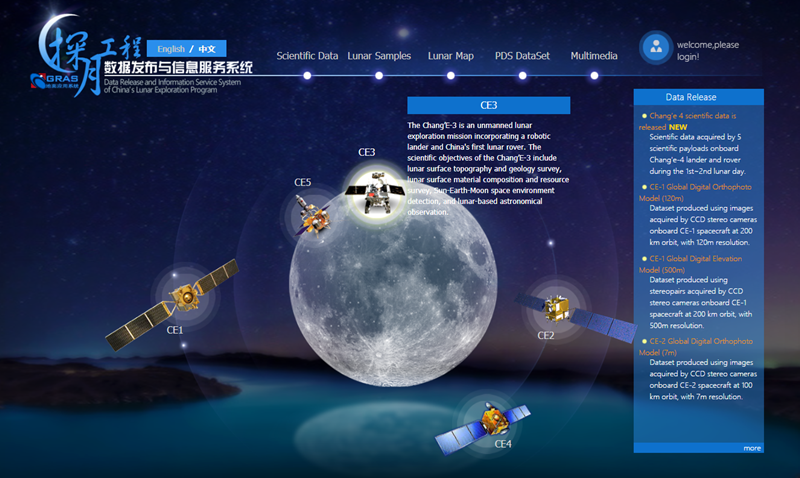
Figure: Homepage of the moon exploration project data release and information service system
Download the full moon data of Chang'e-1 in the quick link provided on the homepage.
DEM: resolution 500 meters, format-tif, the built-in coordinate system-cylindrical projection
DOM:resolution 120 meters, format-tif, the built-in coordinate system-cylindrical projection
After downloading and decompressing, the data can be imported into SuperMap iDesktopX as a raster.
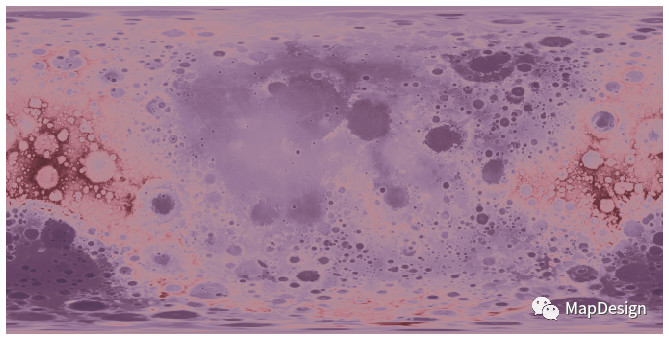
Figure: Full moon DEM

Figure: Full moon DOM
Generate Terrain
In iDesktop, using “Spatial Analysis”-“Surface Analysis”-“3D Rendering Map” to generate a 3D terrain by DEM data. To see more details of terrain, the value of z-factor parameter is suggested to be 5.
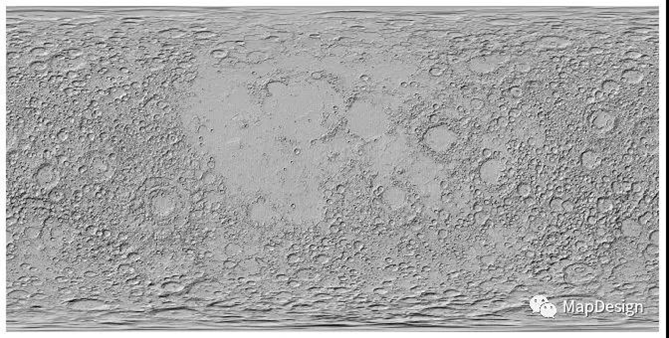
Figure: Moon terrain
Make a map
Set the transparency of the DEM to 40% and overlay it on the moon terrain to get the common 3D rendering map. Users can also adjust the brightness and contrast of the layer appropriately to achieve a more ideal display effect.
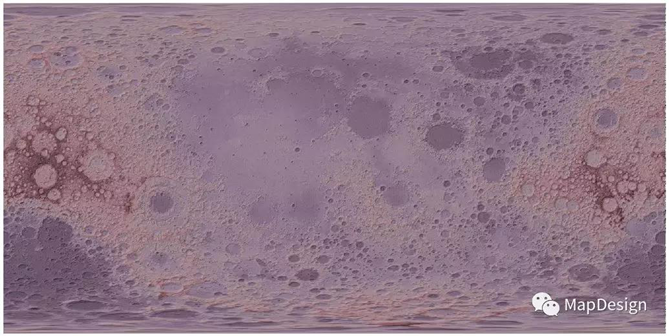
Figure: Moon 3D rendering map (Color table 1)
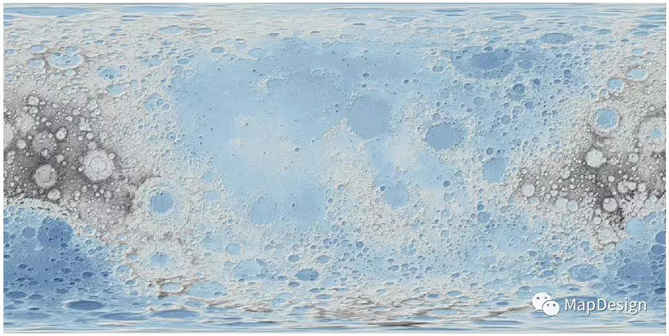
Figure: Moon 3D rendering map (Color table 2)
Similarly, set the transparency of the DEM to 40% and overlay it on the terrain shadow layer. The effect as:
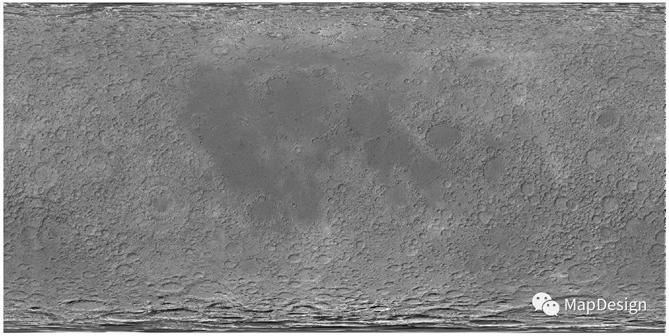
Figure: Moon image terrain map
The above pictures apply simple cylindrical projections technology, that is, equidistant cylindrical projections. Users can select "Map Attributes"-"Dynamic Projection" and set the projection to the hemisphere projection of the north and south poles of the moon. As following figures shows: the left is from the north pole perspective, and the right is from the south pole perspective:
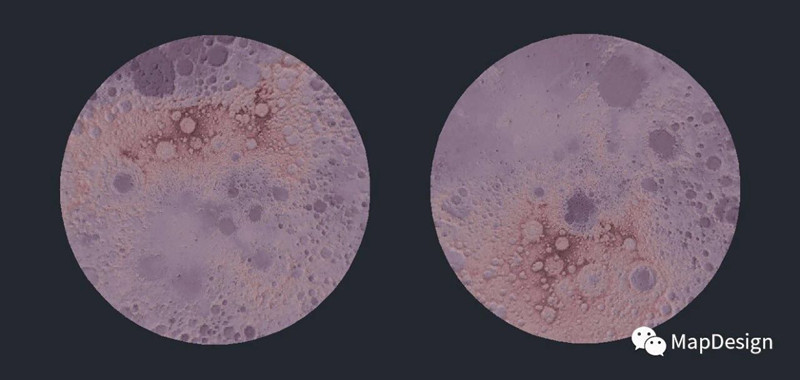
Figure: Moon 3D rendering (hemisphere perspective, color table 1)
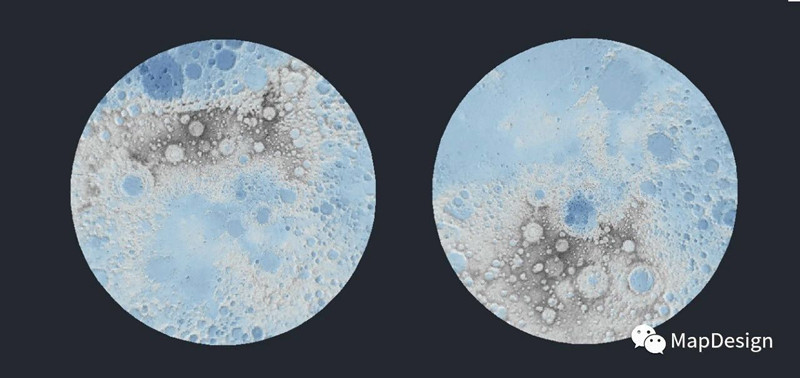
Figure: Moon 3D rendering (hemisphere perspective, color table 2)
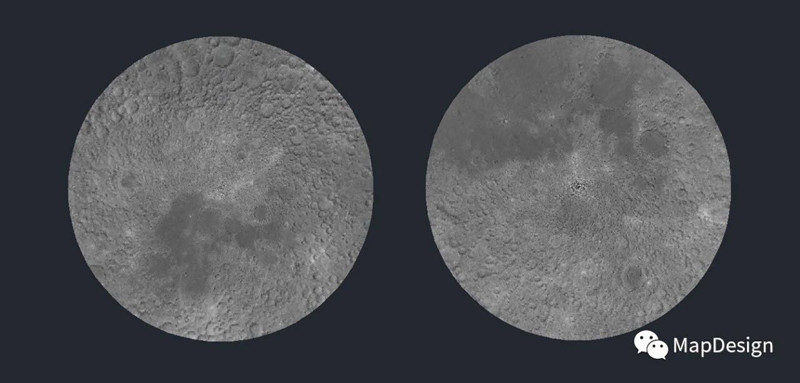
Figure: Moon image terrain map (hemisphere perspective)
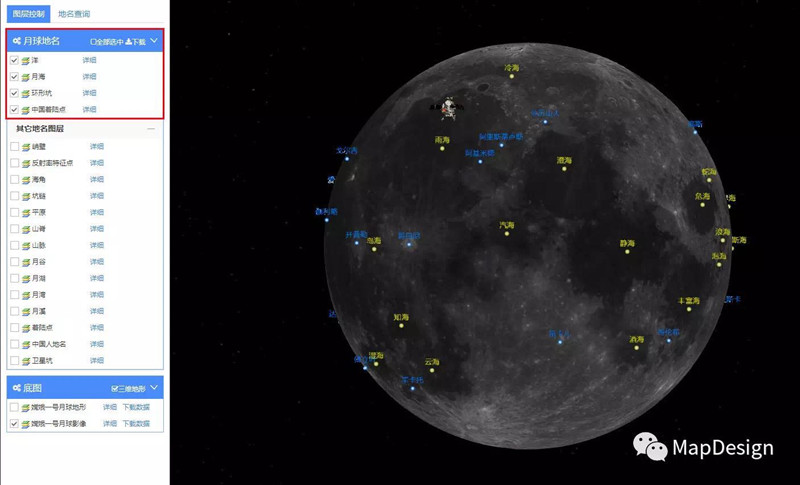
As we can see from the maps, there are many bright or dark circular potholes on the moon's surface. In fact, most of the bright areas are craters, where the space rocks hit the moon's surface. The dark spots are called "sea" because of volcanic eruptions, which is different from the concept of the “sea” from earth. The system provides various types of geographical name data, including lunar mare, ring craters, and landing points on the moon. The data format is shp and it can be downloaded by category in the page.
New 3D GIS Technology in Underground Water Management>
2D and 3D GIS in Natural Resources Management>
New 3D GIS Technology Supports the Construction of "Digital Twins" in Transportation>