Baduk, one of the four traditional art of China, can be played with black and white pieces on a board of 361 crosse. It can be traced back to the period of Emperor Yao, around 2000 BC, China. With SuperMap iDesktop, the maps in style of Baduk can be created.
1. Downloading Data
First of all, the data must be prepared. Users can can download the world data in “SuperMap iDesktop Software”- “Online”-“Resources”-“Online Map”-“World Map”-”Data Download”. Also, if you have the sample data of iDesktop, you can find those data on world folder.
2. Drawing Chessboard
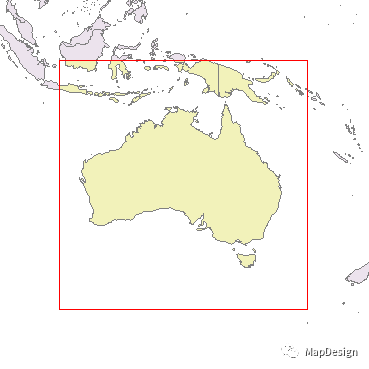
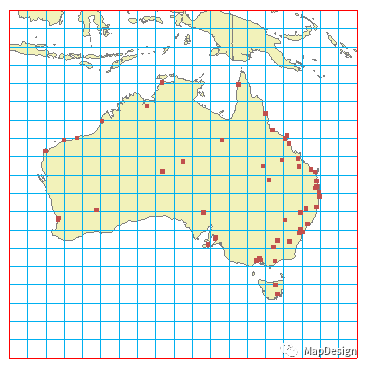
Users can create a new polygon dataset named Frame in data source. In Object Operations tab, users can find a tool to draw a rectangle with a stable height and width. For instance, drawing a 50*50 rectangle around the Australia or wherever you are interested in; then changing the size of map; at last, select the area.
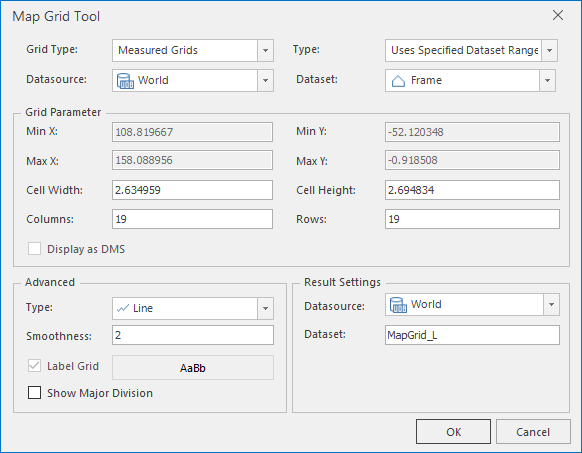
Next, using the function of map grid: in “Map”- “Mapping”, users can create a grid with 19 * 19 columns and rows as the setting below:
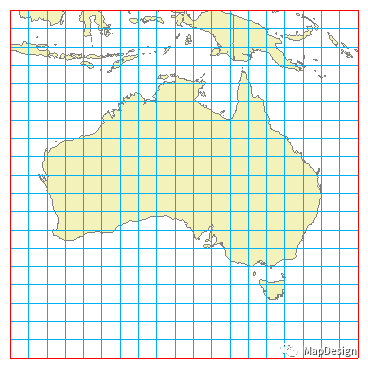
And the map grid has been created would be like:
3. Placing Pieces
In this map, the airports of Australia will betaken as the pieces. The data of airports can be downloaded from OpenFlights (http://openflights.org/data/html), with .csv formal. When imputing data to SuperMap iDesktop, it can be transferred into point dataset, named Airport Points. We can clip this point dataset to obtain the airports which are located in Australia.
While users may find that not all the airport points would be located in the node of the grid lines. Users need to move some of the points to the nearest nodes:
(1) Create grid intersections: Use the "Topology Construction" function in the "Traffic Analysis" tab on the grid line dataset to build a 2D network, then save the intersections in the network dataset as a separate point dataset .
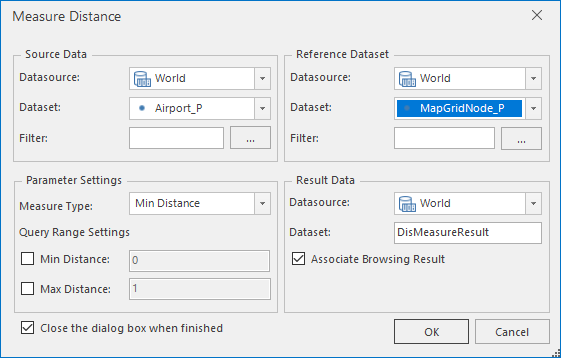
(2) Proximity analysis: Use the "Distance Calculation" function under "Proximity Analysis" in the "Spatial Analysis" tab to calculate the grid intersection closest to the airport. Parameter settings are as follows:
(3) Attribute addition: The result of the proximity analysis is an attribute table that lists the grid point ID closest to each airport point. In order to facilitate the mapping, users can use the grid point ID as a connection, and add the ID of the neighboring airport point to the grid point data set.
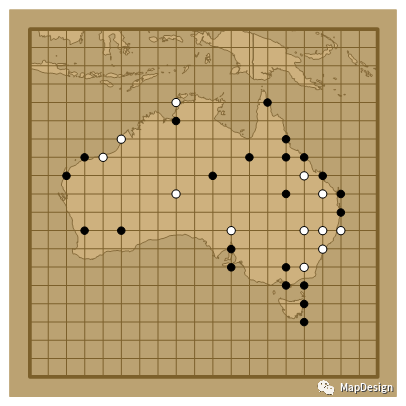
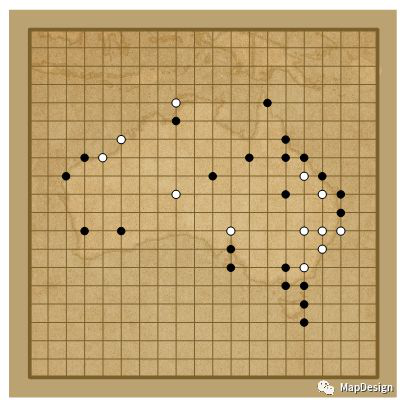
(4) Checkerboard point display: Set the display filter conditions in the "Layer Properties" panel of the grid point layer. Only grid points that are adjacent to the airport point can be displayed, that is, points with airport point ID> 0. By making segmented thematic maps, black and white can be distinguished: when the airport point ID is less than 30, use the black, otherwise use the white.
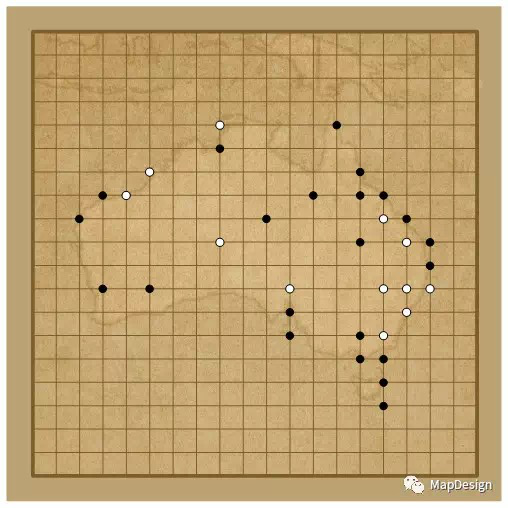
Set the style of each layer, users can get the effect of the following image.
4. Enriching Map
Two buffers for Australia polygon dataset can be create with 30000 and 60000. And the buffers can be fill the color from light to deep:
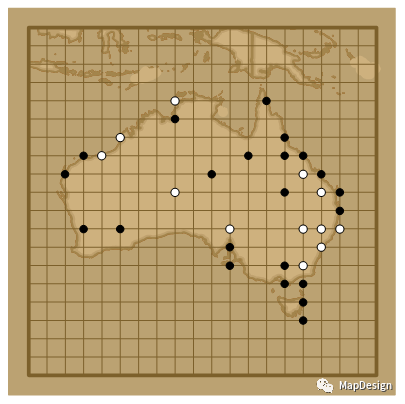
Overlaying a brown paper texture is a good way to enrich the map. Users can input a square picture with brown paper texture into iDesktop. After registration, put the picture at the bottom and set a 50% transparency. Now, a Baduk Map can be created.
Satellite Tracking + Big Data GIS Application in Real-time Ship-controlling>