SuperMap GIS 10i Streaming Data Technology
With the rapid development and popularization of Internet, IoT (Internet of things), cloud computing and other technologies, the global data has been growing exponentially during the past 20 years. We are embracing the era of big data. And mass data including location information are generated, such as social data, mobile signaling data, navigation trajectory data, urban camera data, wearable terminal data, etc., all of which are streaming data.
Streaming data is characterized by large data volume, diverse sensing types and continuous data changes. In view of these characteristics, SuperMap provides a product and technology proposal for streaming data, which can realize real-time processing and analysis of streaming data, as well as analysis and mining of historical data, so as to obtain more data value.
1.1 Products
SuperMap streaming data technology mainly adopts the Streaming data processing extension module (Streaming Service) of SuperMap iServer to realize the reception, storage, processing and output of Streaming data with spatial information. At the same time, UI of stream processing model is provided to lower the threshold of service management. And Users can use SuperMap iClient, SuperMap iDesktop, SuperMap iDesktopX, SuperMap iPortal, SuperMap iMobile to realize streaming data visualization.
In addition, SuperMap supports storing streaming data in SuperMap iServer DataStore (Elasticsearch cluster), analyzing and mining historical data through SuperMap iServer's distributed analysis service. Using the SuperMap iPortal, users can manage streaming data’s resources and services uniformly, and finally realize the streaming data visualization on PC, Web and mobile.
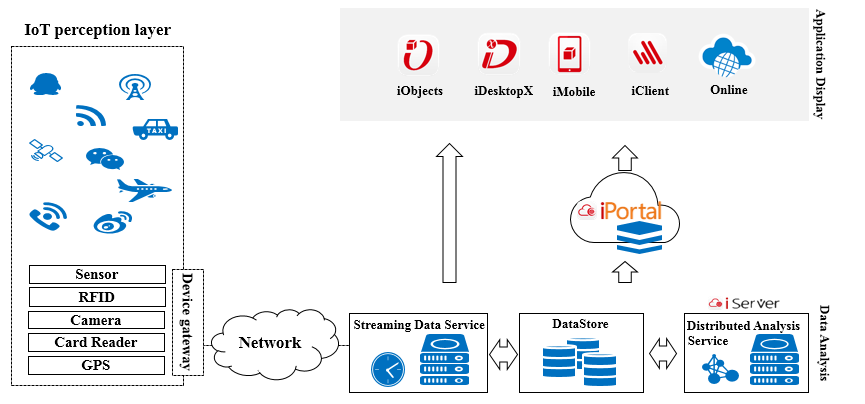
Figure SuperMap Streaming Data Product
1.2 Technology
Through the fusion with Spark Streaming framework, SuperMap streaming data technology has formed an integrated technical scheme including data access, data analysis, data storage, data output and visualization.
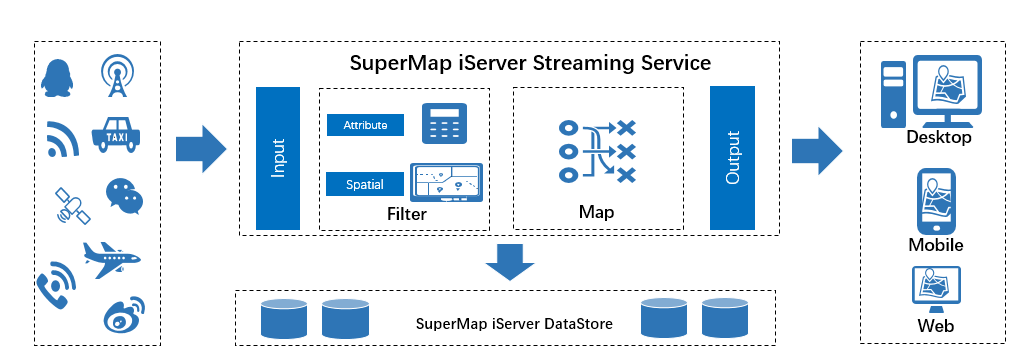
Figure SuperMap Streaming Data Technology
(1) Streaming Data Access
Streaming Service can access common streaming data sources quickly, including data comes from mobile terminal, monitoring sensor, GPS devices, etc. Streaming Service receiver supports access to a variety of mainstream protocol and data format. And the receiver also supports custom extensions.
l Mainstream protocol
Socket, WebSocket, TCP, HTTP, JMS, Kafka, etc.
l Data formats
CSV, TXT, JSON, GeoJSON, etc.
(2) Streaming Data Analysis and Processing
Streaming Service provides a powerful and abundant stream data processing tool for processing and analyzing massive streaming data, including filter function, converter function and attribute connector function etc. The filters function include attribute filters, spatial filters (Geofence) and logical operation filters. Converters include field mapping, field operations, field addition, field deletion, and geographic state converters.
l Attribute filters
Attribute filters filter geographic events based on attribute expressions. Steaming Service provides the attribute filters of numerical field and text field. For example, filtering of numeric field properties supports common numeric comparison operations: greater than, less than and equal to, such as “[speed]>120”. Text field property filtering supports regular expressions, such as “[content] matches CCA[0-9]{4}”.
l Spatial filters (Geofence)
Spatial filters can filter real-time geographic behavior based on spatial relationships. Steaming Service support spatial relation filtering including contain, disjoint, etc. For example, users can determine whether the current point is in the geofence.

Figure Geofence
The police officers can be informed of real-time warning information (SMS, E-mail and other forms) to remind to strengthen vigilance when the police car enters the high incidence area, which is set to be a geofence. The background system can also record real-time and detailed information about the relative position of the police car and the geofence, such as entering or leaving.
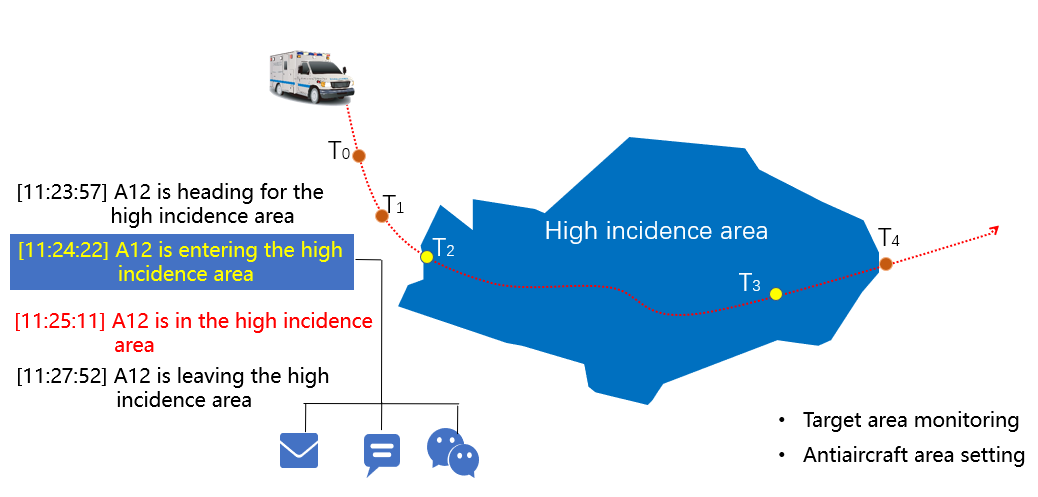
Figure Geofence
l Converter function
The converter function is used for routine processing of streaming data. SuperMap iServer provides field converters and geographical location converters. Field converters include numerical calculation ([ longitude ] / 600000), field mapping ([x] = [ latitude ] / 600000), and field addition ([ receivertime ] = currentTime())”. Geographical location converters support real-time geolocation of dynamic targets relative to Geofence.
SuperMap GIS Streaming Service integrates Spark Streaming, a distributed computing framework, to support intelligent Streaming Service’s cluster architecture and dynamic expansion. As is shown in figure5, in the cluster environment (4 node: 16GB, 4-core, 1Gb networks), the entry and exit of civilian aircraft relative to 3,455 geofence was calculated in real time. When processing the same input data, the performance is improved linearly with the increase of nodes. In the same node, the performance does not decrease exponentially as the data increases.
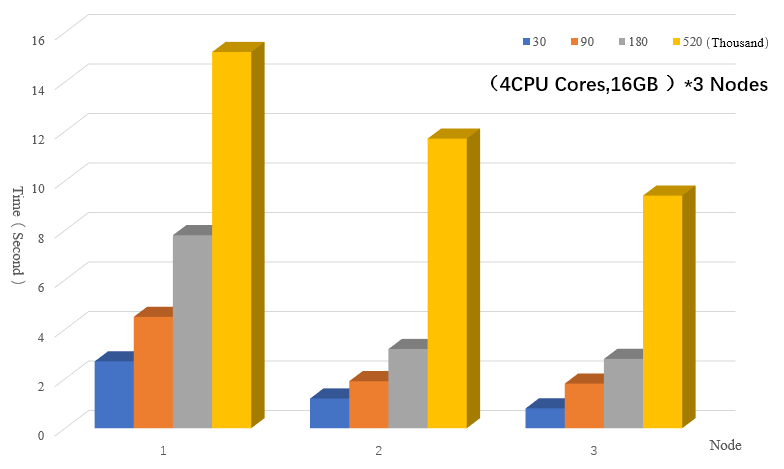
Figure Performance Comparisons Under Different Compute Nodes
(3) Streaming Data Storage
Streaming data in SuperMap iServer is mainly stored using Elasticsearch distributed database. Elasticsearch supports for high concurrency bulk writing, spatial query capability based on geographical coordinates (latitude and longitude), GeoHash spatial index and inverted index, and achieves stable, reliable and fast search of streaming data.
(4) Streaming Data Output
SuperMap iServer Streaming Service outputs data through an output connector, which supports a variety of mainstream protocols and data formats, as well as custom extensions. For example, SuperMap iServer Streaming Service can output data to SuperMap iServer DataStore to realize the storage of historical data (such as creation, modification, etc.). The service supports data output in the form of messages. And the DataFlow Service sends the stream data in the form of a WebSocket protocol to the client.
n Mainstream protocol
Socket, WebSocket, TCP, HTTP, JMS, Kafka, etc.
n Multiple data formats
CSV, TXT, JSON, GeoJSON, etc.
(5) Streaming Data Visualization
Streaming data is visualized in various SuperMap terminal products, including desktop, mobile, web. iDesktopX supports production of real-time screens. SuperMap iPortal provides a variety of Web Apps such as MapDashboard,DataInsights and DataViz. They supports streaming data display, which can display maps in real time and make thematic maps, as well as provide a variety of statistical charts for large screen display.
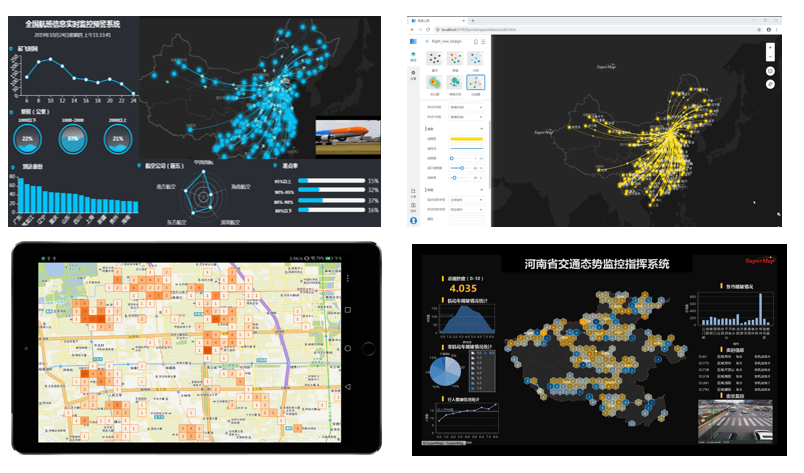
Figure Streaming Data Visualization
n Real-time visualization of data
As is shown in figure, SuperMap displays the position and status of the current target at a certain moment in real time. SuperMap also supports the real-time visualization of the result, which comes from distributed analysis of streaming data (such as heat distribution).
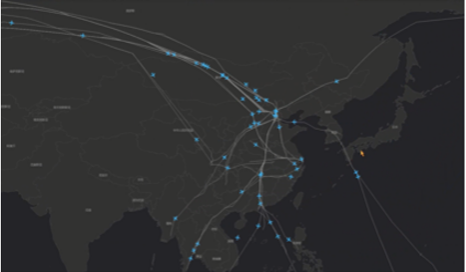
Figure Real-Time Visualization of Streaming Data
n Visualization of historical streaming data
SuperMap displays the streaming data by the time series via processing and analyzing the historical streaming data, such as Reconstruct Tracks.
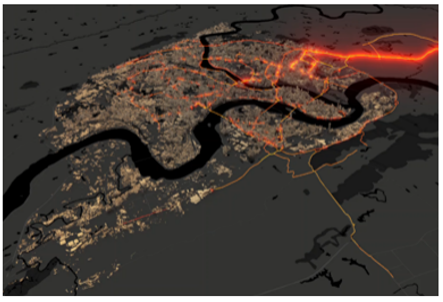
Figure SuperMap Reconstruct Tracks of Streaming Data
(6) Historical Streaming Data Mining
SuperMap supports storing historical streaming data in SuperMap iServer DataStore to provide data sources for big data analysis services. The distributed computing of massive streaming data is realized through Distributed Analysis Service. The analysis results are stored in SuperMap iServer DataStore and output to SuperMap terminal products for visualization. SuperMap provides more than 20 kinds of distributed analysis operators, including Calculate Density, Find Hot Spots, Calculate OD Matrix, etc., to realize further analysis and mining of streaming data.
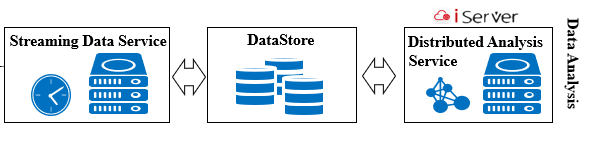
Figure Historical Streaming Data Mining
1.3 Typical Case
(1) Ship Industry
In a ship big data project, user’s requirements include: 1) Maintaining real-time location data storage and spatial visualization of 2.8 million ships per day; 2) Realizing efficient storage and custom query of the existing data, which includes 10 billion records; 3) Segmenting ship data (about 1.6 billion) in half a year by day or hour, and reconstructing tracks within the time range.
In response to the above requirements, SuperMap provides a solution based on streaming data storage technology, streaming data calculation technology and streaming data visualization technology, realizing real-time monitoring of ship data, Reconstruct Tracks and other functions. The project has completed the construction of two application systems (online data analysis system, general data query system) and a resource database (ship database). The project supports the storage management and distributed analysis of user’s data based on SuperMap SDX+ and SuperMap iObjects Java for Spark. Meanwhile, it provides users with ship situation extraction, anomaly mining and other functions in the form of service (SuperMap iServer). Finally, relevant applications are provided to users through the Web and mobile.
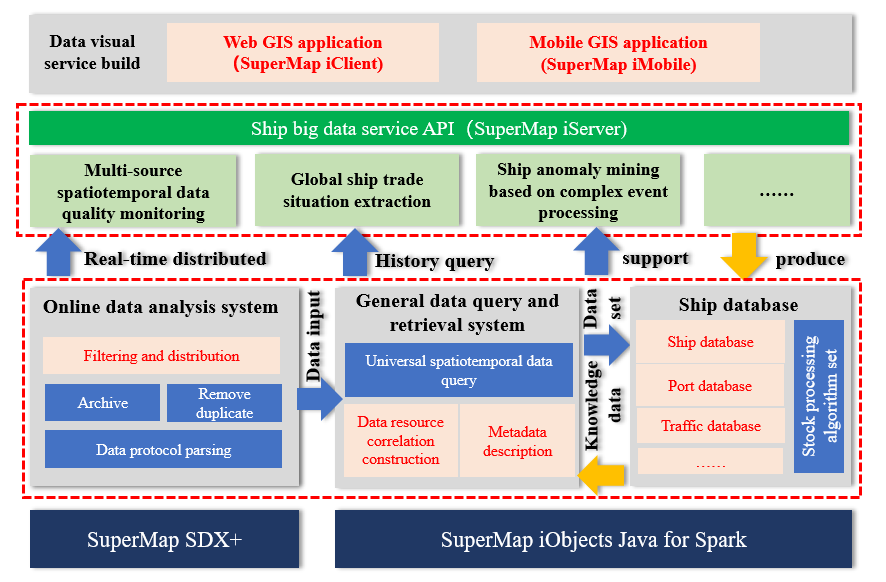
Figure Historical Streaming Data Mining
Typical functions provided by the project:
1) Real-time monitoring
The ship system sends real-time information through Socket and the system accesses the data through Streaming Service. After some data processing, the streaming data accesses to Dataflow Service sending data to SuperMap iClient. And the StreamLayer of SuperMap iClient realizes the visualization of streaming data, real-time monitoring and other related functions. At present, the real-time loading and query of 2.8 million ships are realized and the response time is less than 1 second.
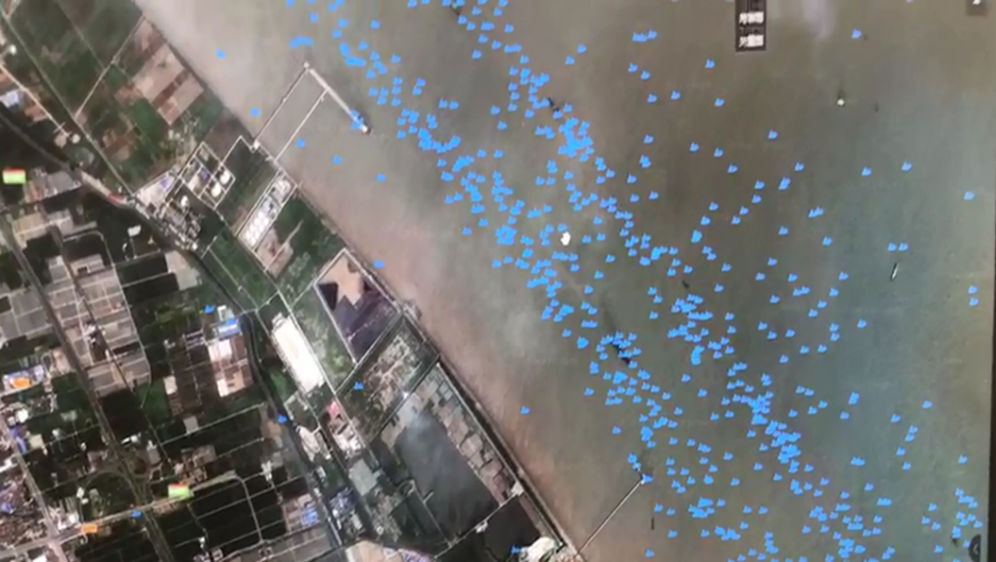
Figure Real-Time Monitoring of Streaming Data
2) Reconstruct Tracks
Reconstruct Tracks is reconstructing the trajectory line based on the time information. In this project, the ship’s track was playbacked of multiple periods in the custom area according to the historical data. At the same time, the segmentation distance and the segmentation time can be set to segment the track.
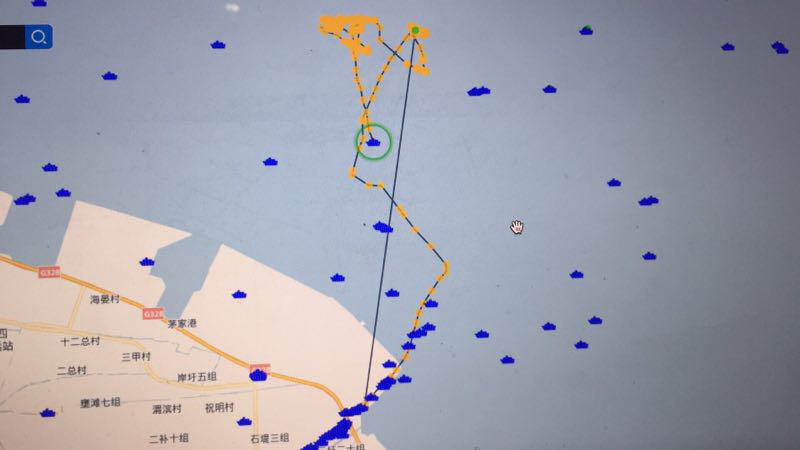
Figure Ship Reconstruct Tracks
3) Statistical analysis
According to the statistics and analysis of the historical ship data, the key regions in global shipping, including the wharf, anchorage area, no-sail area and waterway, are rapidly calculated and analyzed. At the same time, the global ship traffic density was calculated come from the historical data of Automatic Identification System (AIS).And the reception quality or blind area of AIS was evaluated, which providing a basis for the supplement and transmission optimization of AIS base stations.
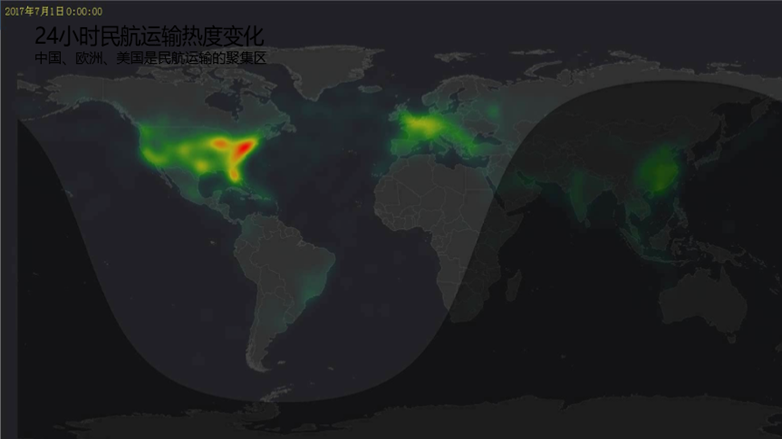
Figure Analysis of Ship Distribution
Satellite Tracking + Big Data GIS Application in Real-time Ship-controlling>