Air Pollution Monitoring Platform is an award-winning work of the SuperMap GIS Contest.
In recent years, with the rapid development of the economy and industry, more pollutants are released into the air due to industrial production, coal combustion and automobile exhaust, and the resulting environmental problems are becoming more serious. Environmental pollution affects people's health and hinders the development of society.
We developed an air pollution monitoring platform based on SuperMap GIS 10i (2020), combining machine learning and in-depth prediction models, hoping to assist government agencies, scientific researchers and the public.
System function design
This system is a smart management system that integrates WebGIS technology, big data analysis, and BILSTM cyclic neural network prediction model. From design to implementation, the platform is from the perspective of users, providing a reference for public travel and environmental governance departments.
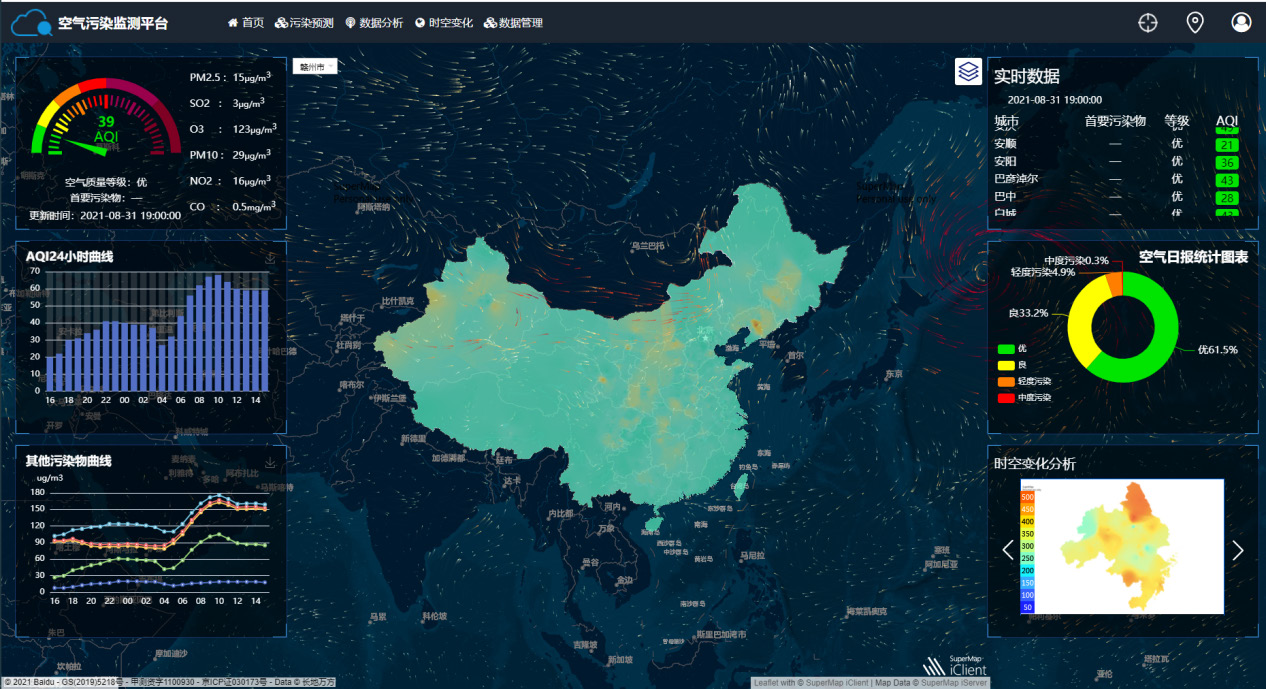
• Visual display of air quality data
The home page of the system adopts the design of the data panel floating on the full-screen map, which is convenient for people to directly view air pollution information. The system uses open-source front-end framework development kits such as Echart and Bootstrap for intuitive real-time data display.
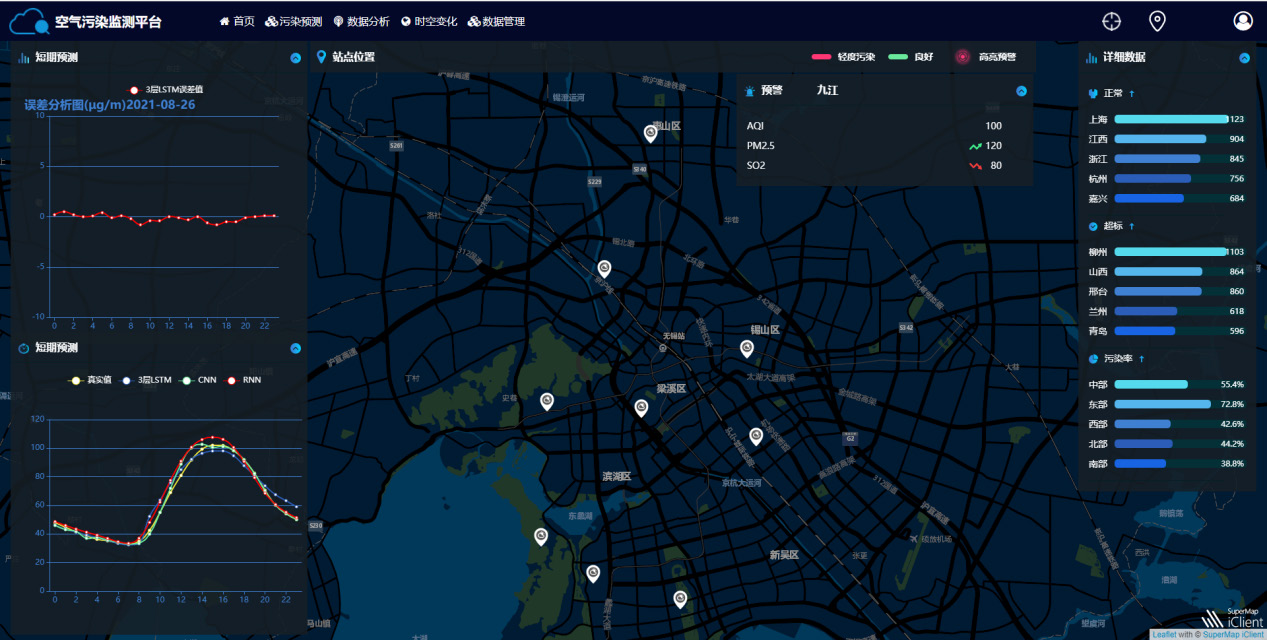
• Air quality forecast
Air quality prediction is an important module in the system. Air quality affects people’s health and daily life. To effectively reduce the adverse effects of air pollution on people, it is very important to predict air quality. The prediction results can also be used as the basis for environmental governance departments to take measures in advance. The masses can also take preventive measures in advance according to the prediction results, arrange their lives reasonably, and avoid adverse effects caused by air pollution. The system uses a three-layer LSTM prediction model to make short-term predictions of air pollution, and compares the accuracy with traditional CNN and RNN models. The front-end interface shows the prediction accuracy and prediction results intuitively to users in two ways: error analysis graph and accuracy comparison graph.
• Analysis of air quality data
The air quality data is composed of six pollutants (PM2.5, PM10, SO2, NO2, O3, CO). The system hereby analyzes the correlation analysis between AQI and the six pollutants and the correlation analysis between the six pollutants, providing a decision-making basis for environmental governance.
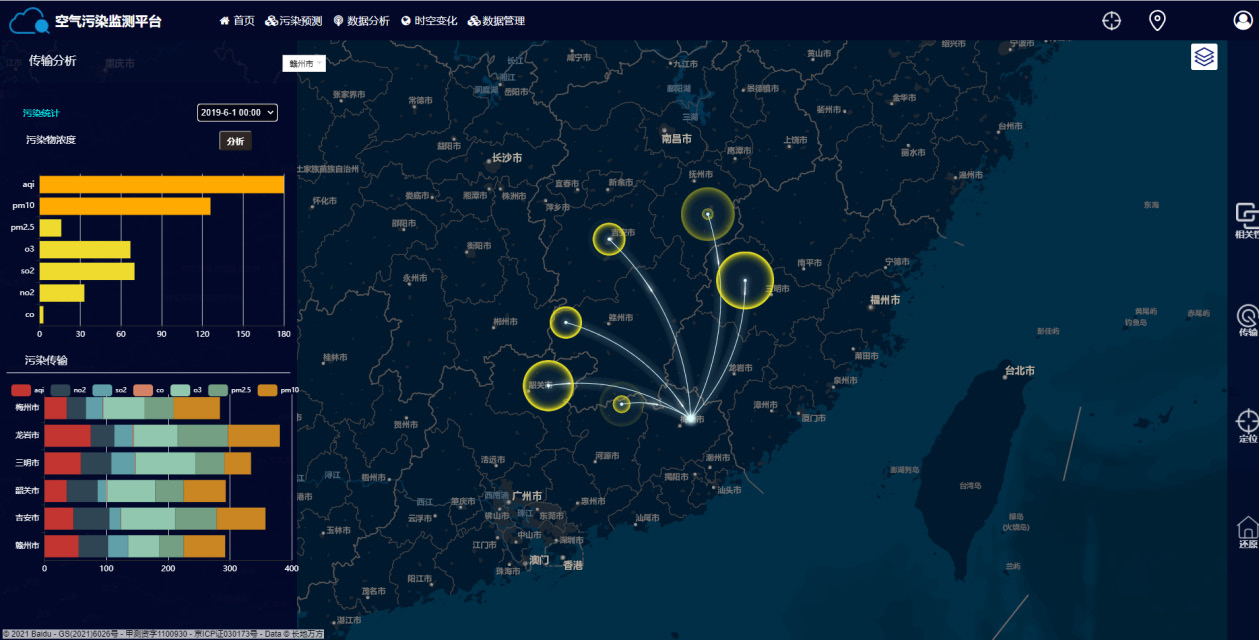
• Urban pollution transmission analysis
Users can select the central city and surrounding cities to simulate pollution transmission according to the city table, and then provide a new perspective on pollution governance.
• Temporal and spatial variation of air quality data
This system stands on the spatial scale of urban agglomerations and analyzes the evolution of pollution in combination with time and space characteristics. Users can select the time and urban agglomerations to view the evolution of pollution, and then carry out information mining on air pollution big data to find laws.
• Air quality data management
Data management adopts MySQL database and Django back-end management and distribution, which can handle massive air quality data generated every moment in various regions of the country. It has good and complete data management functions, and it is convenient for administrators to perform flexible operations such as adding, deleting, modifying and querying data.
Advantages of systems
1. The air quality data is displayed visually to the user in charts, and the real-time air quality data of cities across the country is scrolling and the interface is beautiful.
2. Users can query the air quality pollution data of provinces, cities, current cities, and current locations through various query methods.
3. The system uses the LSTM prediction model to make short-term predictions of air quality and provide a decision-making basis for the environmental governance department. The masses can also plan according to the forecast results, plan travel in advance, and avoid adverse effects caused by air pollution.
4. Air pollution data is spatially continuous and can be analyzed by spatial interpolation. The system calculates the area data of other regions through the known national control site data, and then obtains more practical results.
5. Air quality data is composed of six pollutants (PM2.5, PM10, SO2, NO2, O3, CO). The system can conduct a correlation analysis between AQI and six pollutants, and can further understand the specific reasons for regional air pollution, to provide a basis for environmental protection.
6. From the perspective of urban agglomeration, the system analyzes the evolution of pollution in combination with time and space characteristics, and can simulate the evolution of urban agglomeration and national pollution for users.
7. Air quality data management adopts MySQL database and Django back-end management and distribution, and administrators can flexibly and conveniently store, add, delete, modify and query data. It will also be more convenient for the front end to call a large amount of data, providing convenience for big data display and analysis.
Summary
The data of this system mainly comes from web crawling in Python, applications from the official website of the China National Environmental Monitoring Centre, and downloads from related meteorological websites. We process the data with GIS technology, and after obtaining the target data, visualize the data through SuperMap iDesktop and publish it to the iServer service. Then, we use the Django back-end framework as the carrier, combined with the deep learning neural network analysis and prediction model, to make short-term predictions of air pollution. Finally, the prediction results of the prediction model are better compared with the real data.