1. Background
Urban underground utilities are a big part of urban infrastructure. Its stable operation is vital to the normal operation of a city. Germany is one of the countries with early urbanization development, whose urban pipelines are characterized by density and complexity of spatial locations and varieties, including water supply, drainage, gas, heat, electricity, communication, etc. The traditional 2D underground utility management mode is comparatively less intuitive and cannot meet the current practical needs of 3D expression, spatial analysis and application of urban underground utility. Therefore, a 3D GIS system for integrated management of urban underground utility is now showing its necessity for a modern city.
2. Objectives of the system
The system integrates the data of various pipelines in the Döteberg region of Germany and conducted a unified information management, which digitalizes the underground utility network and achieves the 2D-3D integrated management.
The system is built based on the following objectives:
Improve the management ability and efficiency of relevant management departments for underground pipelines
Provide information resources for urban planning, construction and management
Provide data support for smart city construction
Provide decision support for urban sustainable development and disaster prevention and reduction
3. Key technologies
3.1 Rapid development of component products based on SuperMap iObjects .NET
The system adopts SuperMap iObjects .NET component development platform. As a service-oriented enterprise GIS platform product, it enables users to quickly build professional and powerful application software. SuperMap iObjects .Net is equipped with rich GIS functions, and the granularity of function modules is reasonable, so that users can obtain customized functions tailored for their own business through modular combination according to their actual needs.
3.2 Efficient pipeline data processing flow
Pipeline data usually comes from construction design drawings, geophysical prospecting data and underground surveying. SuperMap GIS platform supports a variety of mainstream data formats and different data import modes, so as to meet the needs of data processing in actual business and improve data processing efficiency. SuperMap GIS also provides rich pipeline data inspection and processing tools, such as format conversion, topology checking, coordinate conversion, object editing, etc., which can quickly implement the preprocessing of pipeline data.
3.3 Comprehensive application of 2D and 3D integration technology
In terms of rapid construction and application analysis of 3D pipelines, SuperMap provides a fast, efficient, perfect and practical technical scheme. Thus, it can integrate data management, application development, 2D and 3D expression, symbol system and analysis and application functions. In particular, it is widely used in urban planning, engineering facilities management, etc., providing decision support for multi-industry applications in smart cities.
3.4 Multi-source data integration technology
The 3D pipeline scene involves the organization and management of multi-source data. The multi-source 3D data integration technology based on SuperMap supports oblique photogrammetry model data, architectural design model data, point cloud, underground 3D pipeline, terrain and other data. This technology breaks through the technical bottleneck of loading and managing massive 3D data, and provides an open, standard and universal data foundation for 3D spatial data sharing and interoperability between different application systems. At the same time, it is also compatible with a variety of software and hardware environments, which greatly reduces the costs of construction, management and maintenance of the 3D GIS application system.
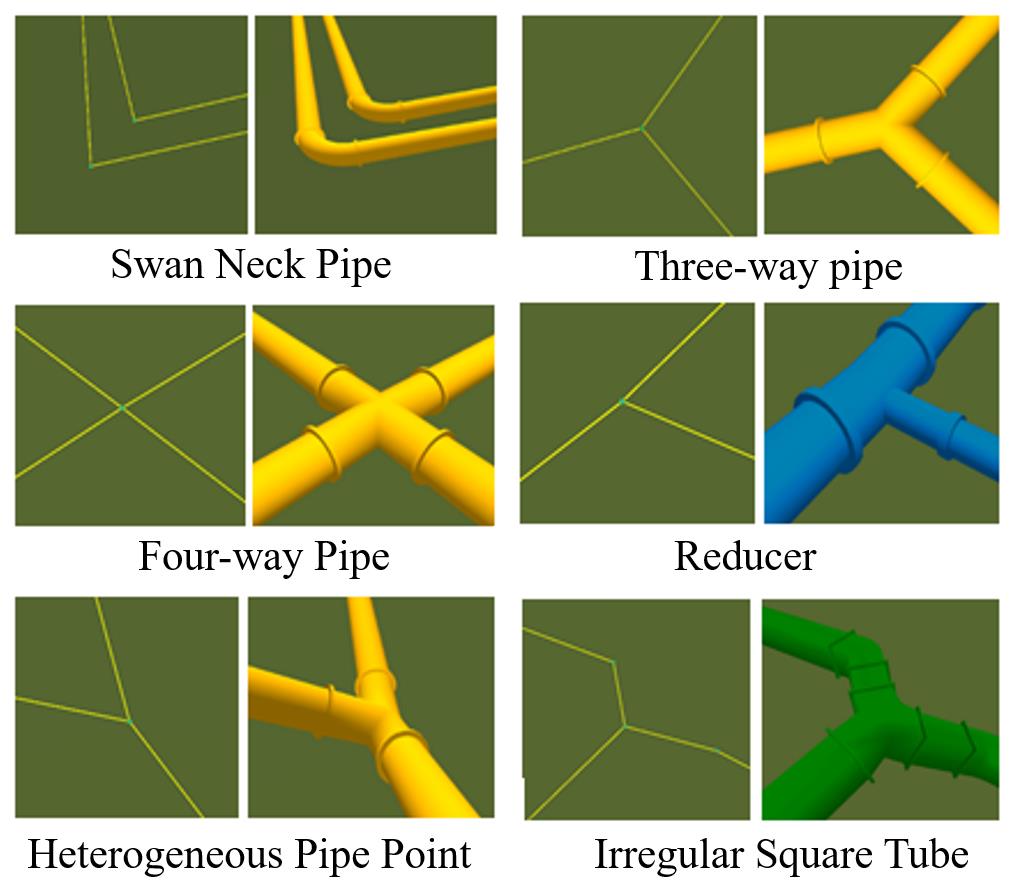
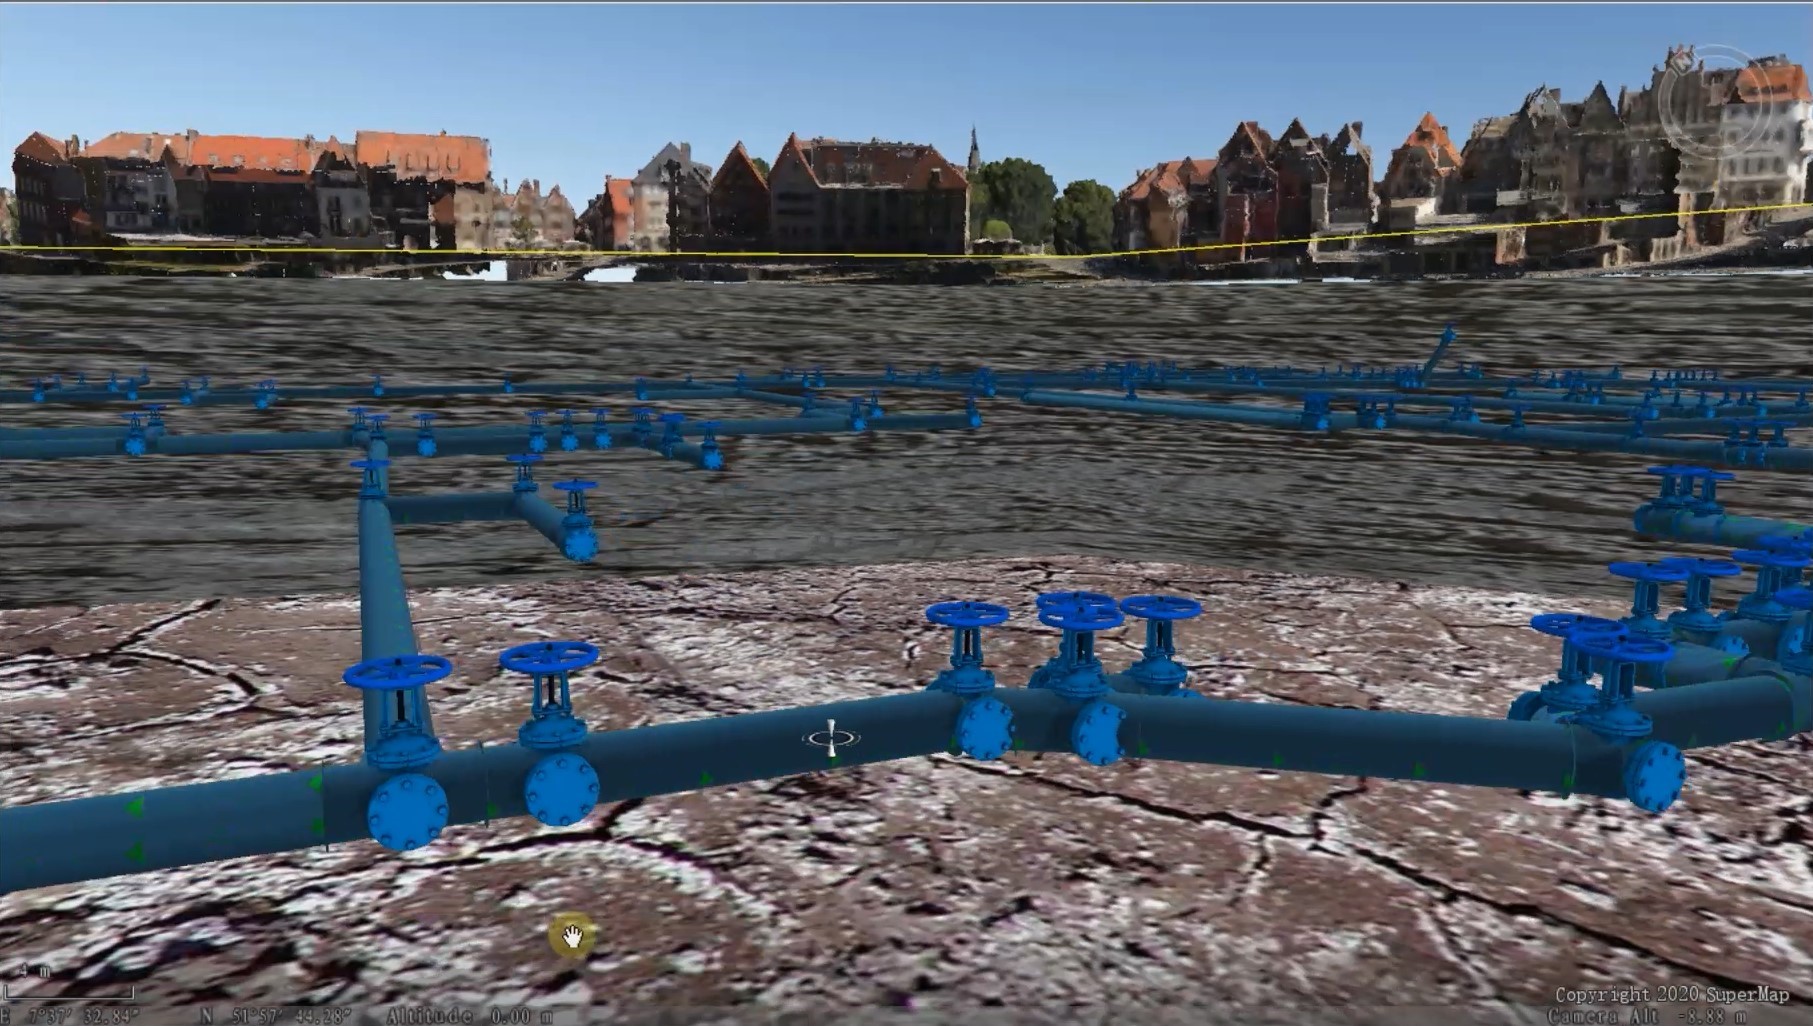
3.5 Customized 3D pipeline symbol library
SuperMap innovatively developed 3D pipe point, pipeline symbol and adaptive pipe point symbol technology based on 2D and 3D integration technology, and provided users with a rich default symbol library to help users quickly build 3D pipeline scenes.
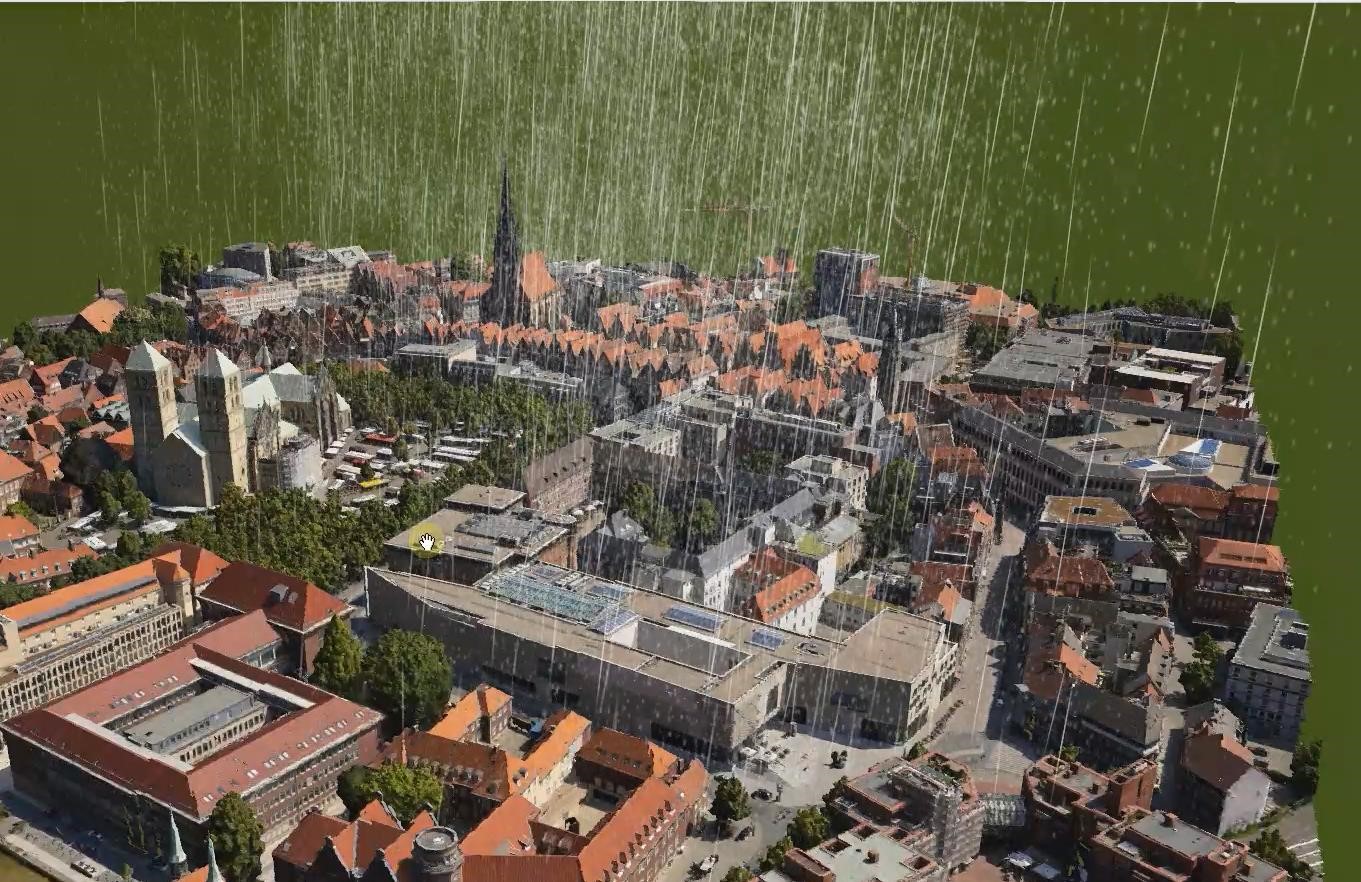
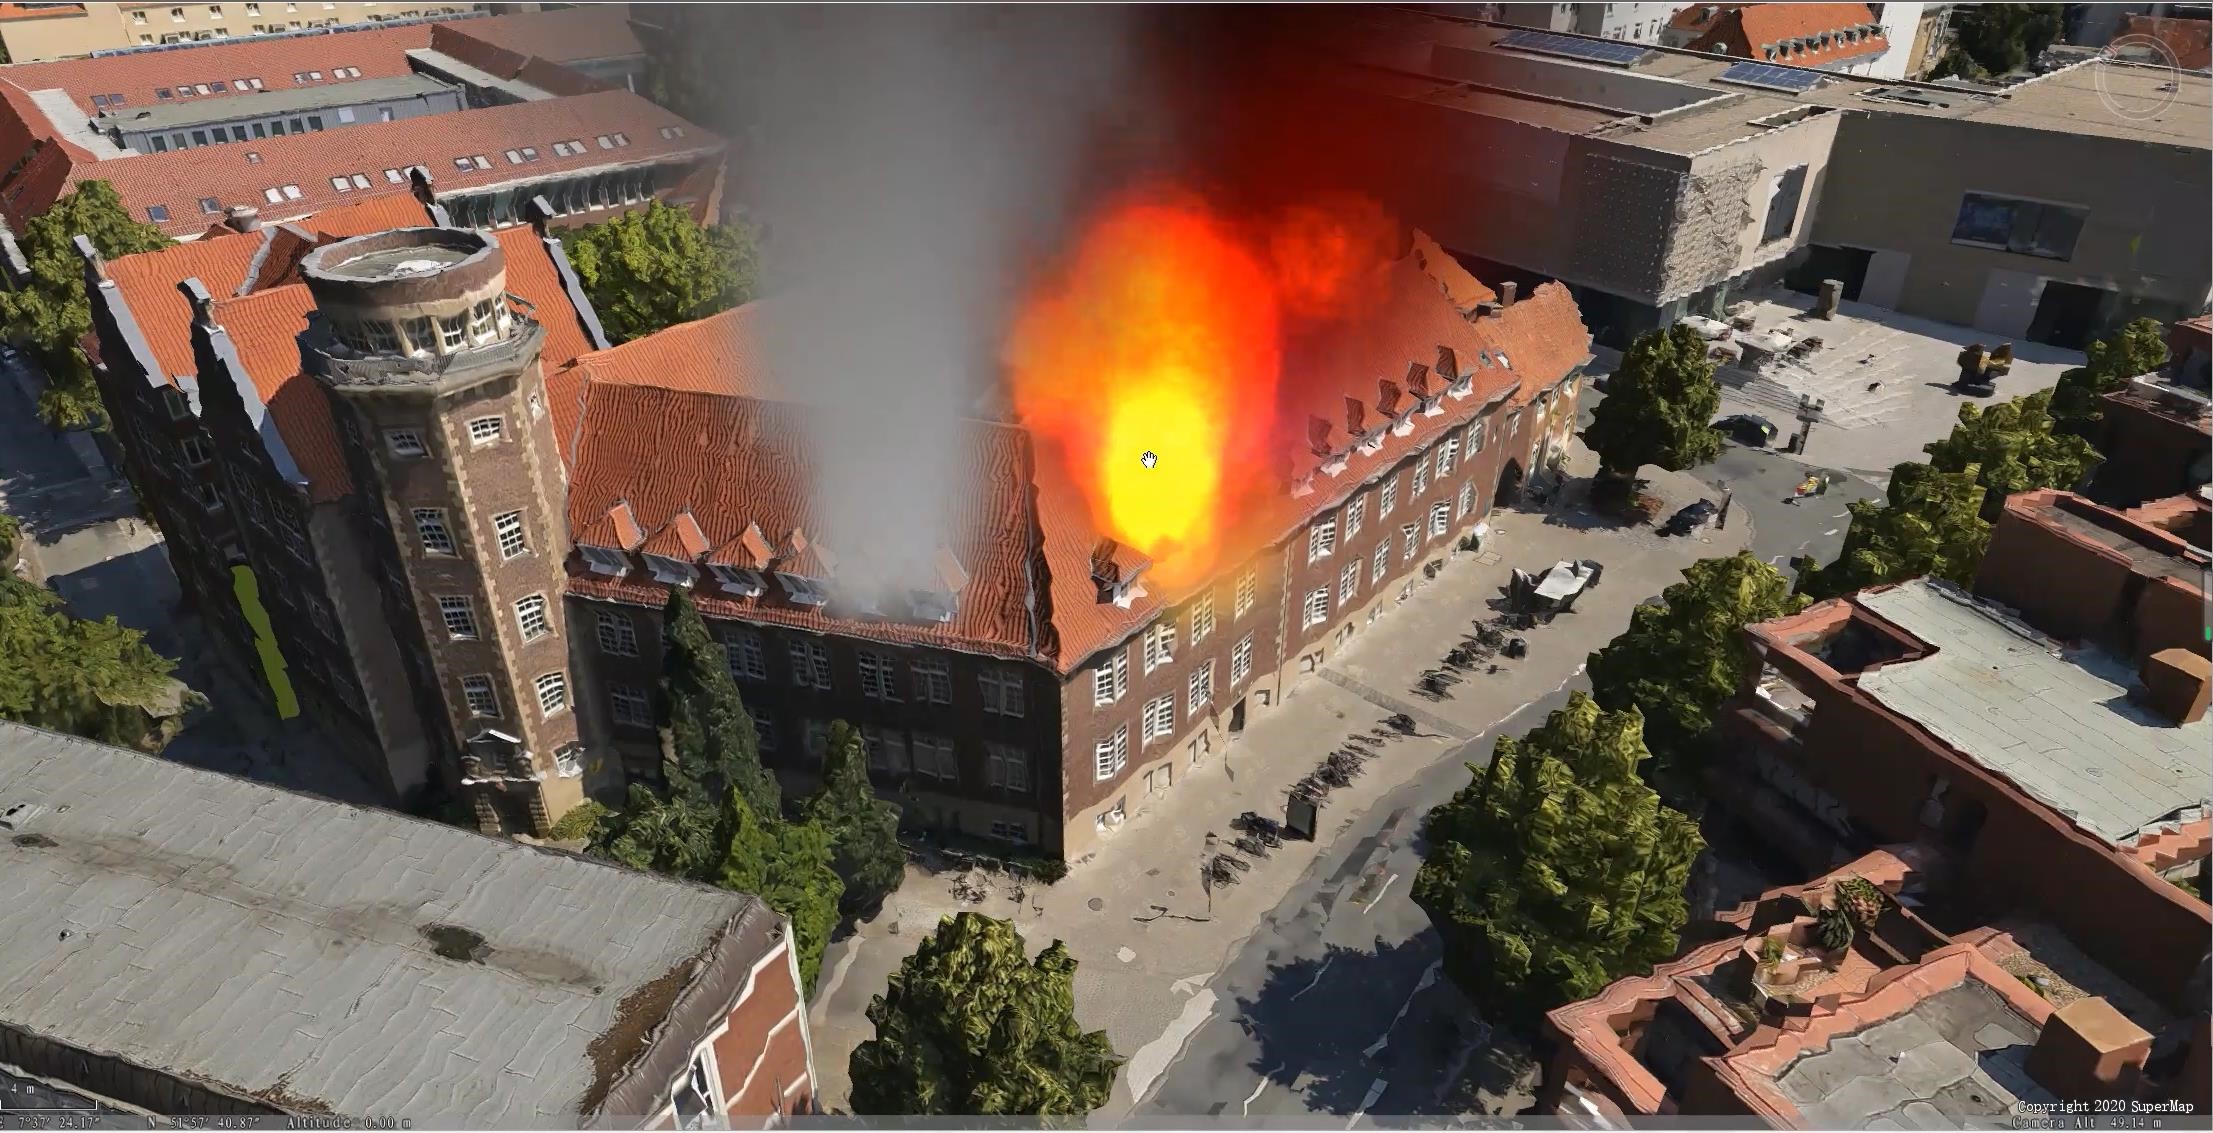
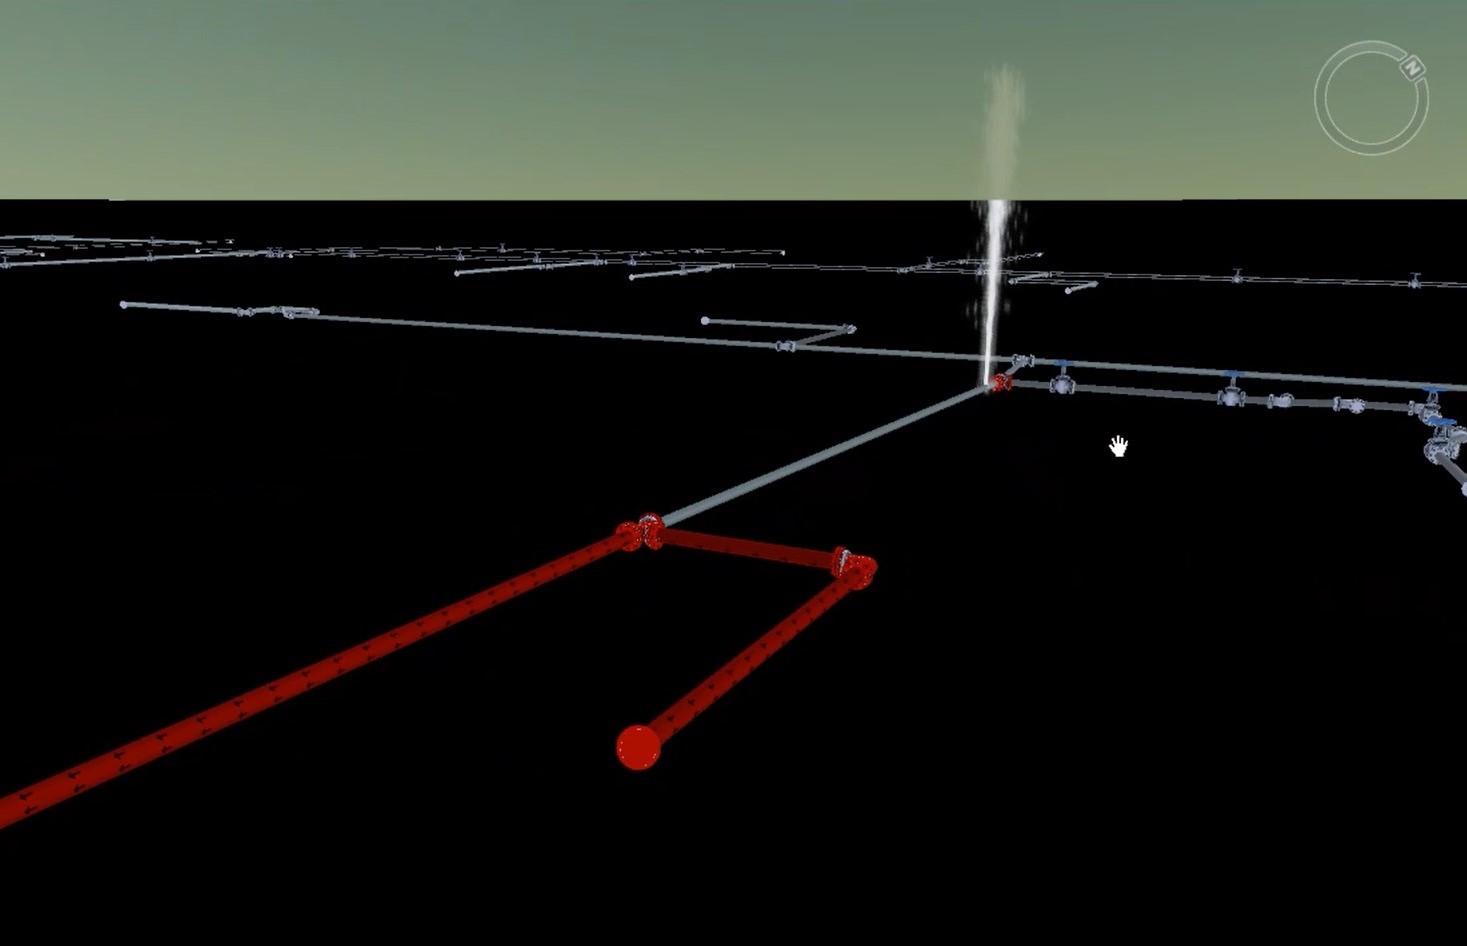
3.6 3D special effect based on high-performance particle system
SuperMap GIS not only supports a variety of 3D special effects, but also provides a high-performance particle system, which can be great support for the construction of high realistic 3D scenes. It can be used to simulate natural phenomena such as flame, fountain, rain and snow. SuperMap particle special effect system has been widely used in emergency relief, meteorological simulation, etc.
3.7 Ability to visualize massive data
SuperMap GIS provides a variety of technologies to improve rendering performance, including engine rendering technology, LOD technology, batch rendering technology, texture compression technology, large file storage and other technologies. LOD multi-level of detail technology also ensures the rendering effect and the stability of massive data loading, so as to successfully solve the technical problems such as the display and management of massive 3D pipeline data.
4. Functions of the system
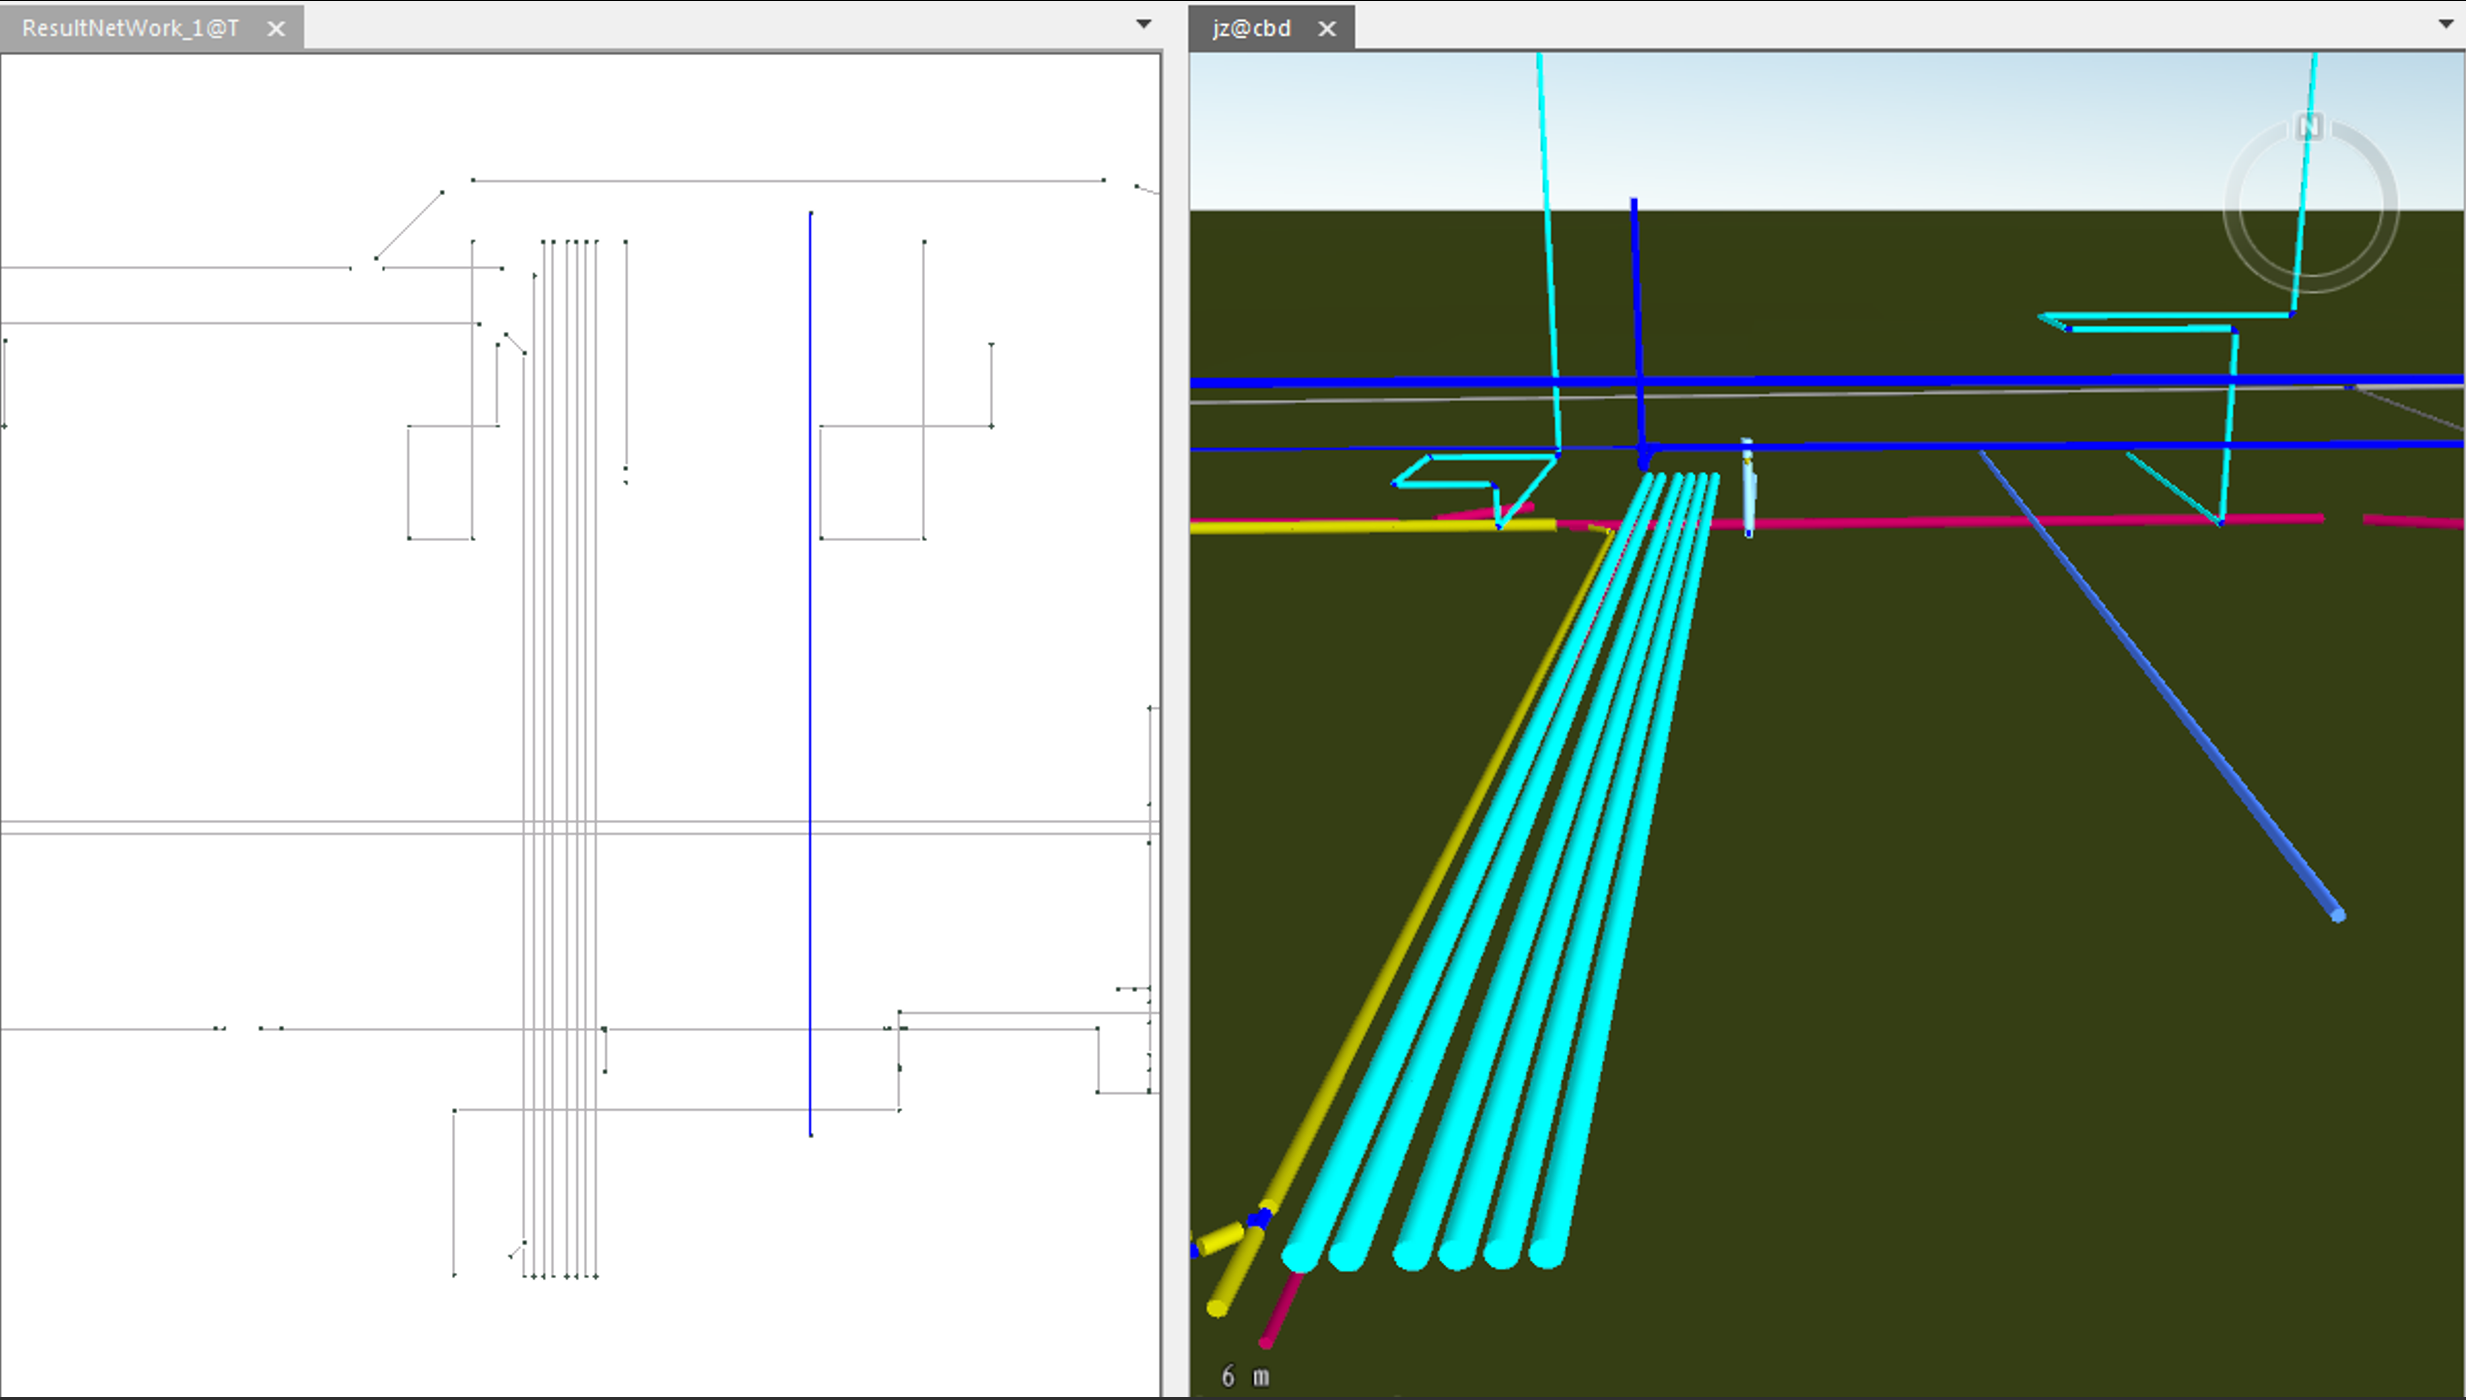
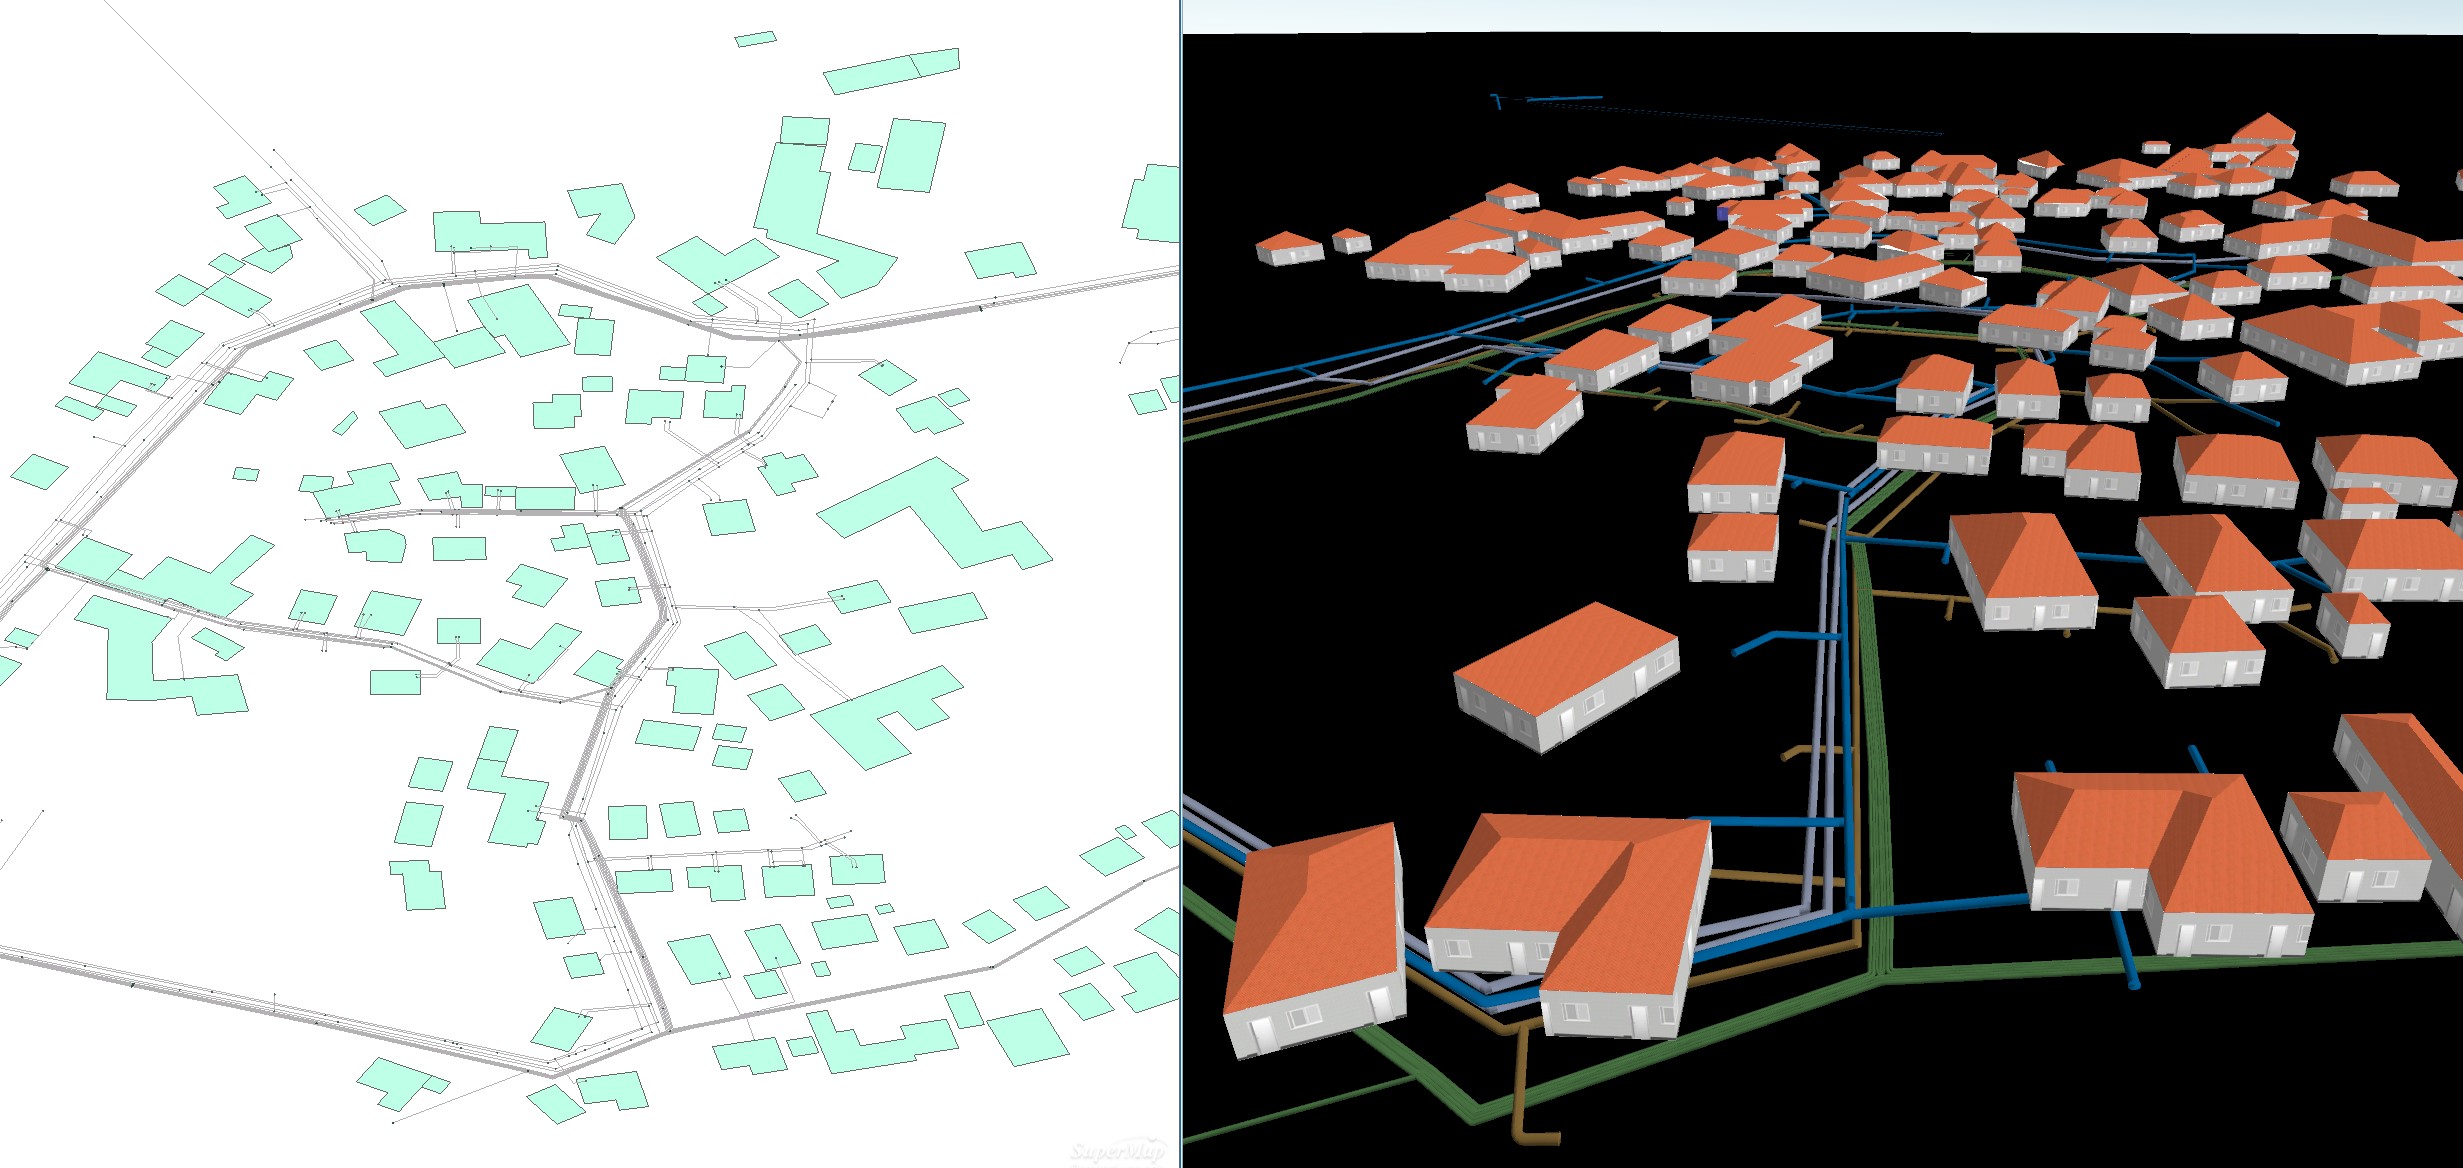
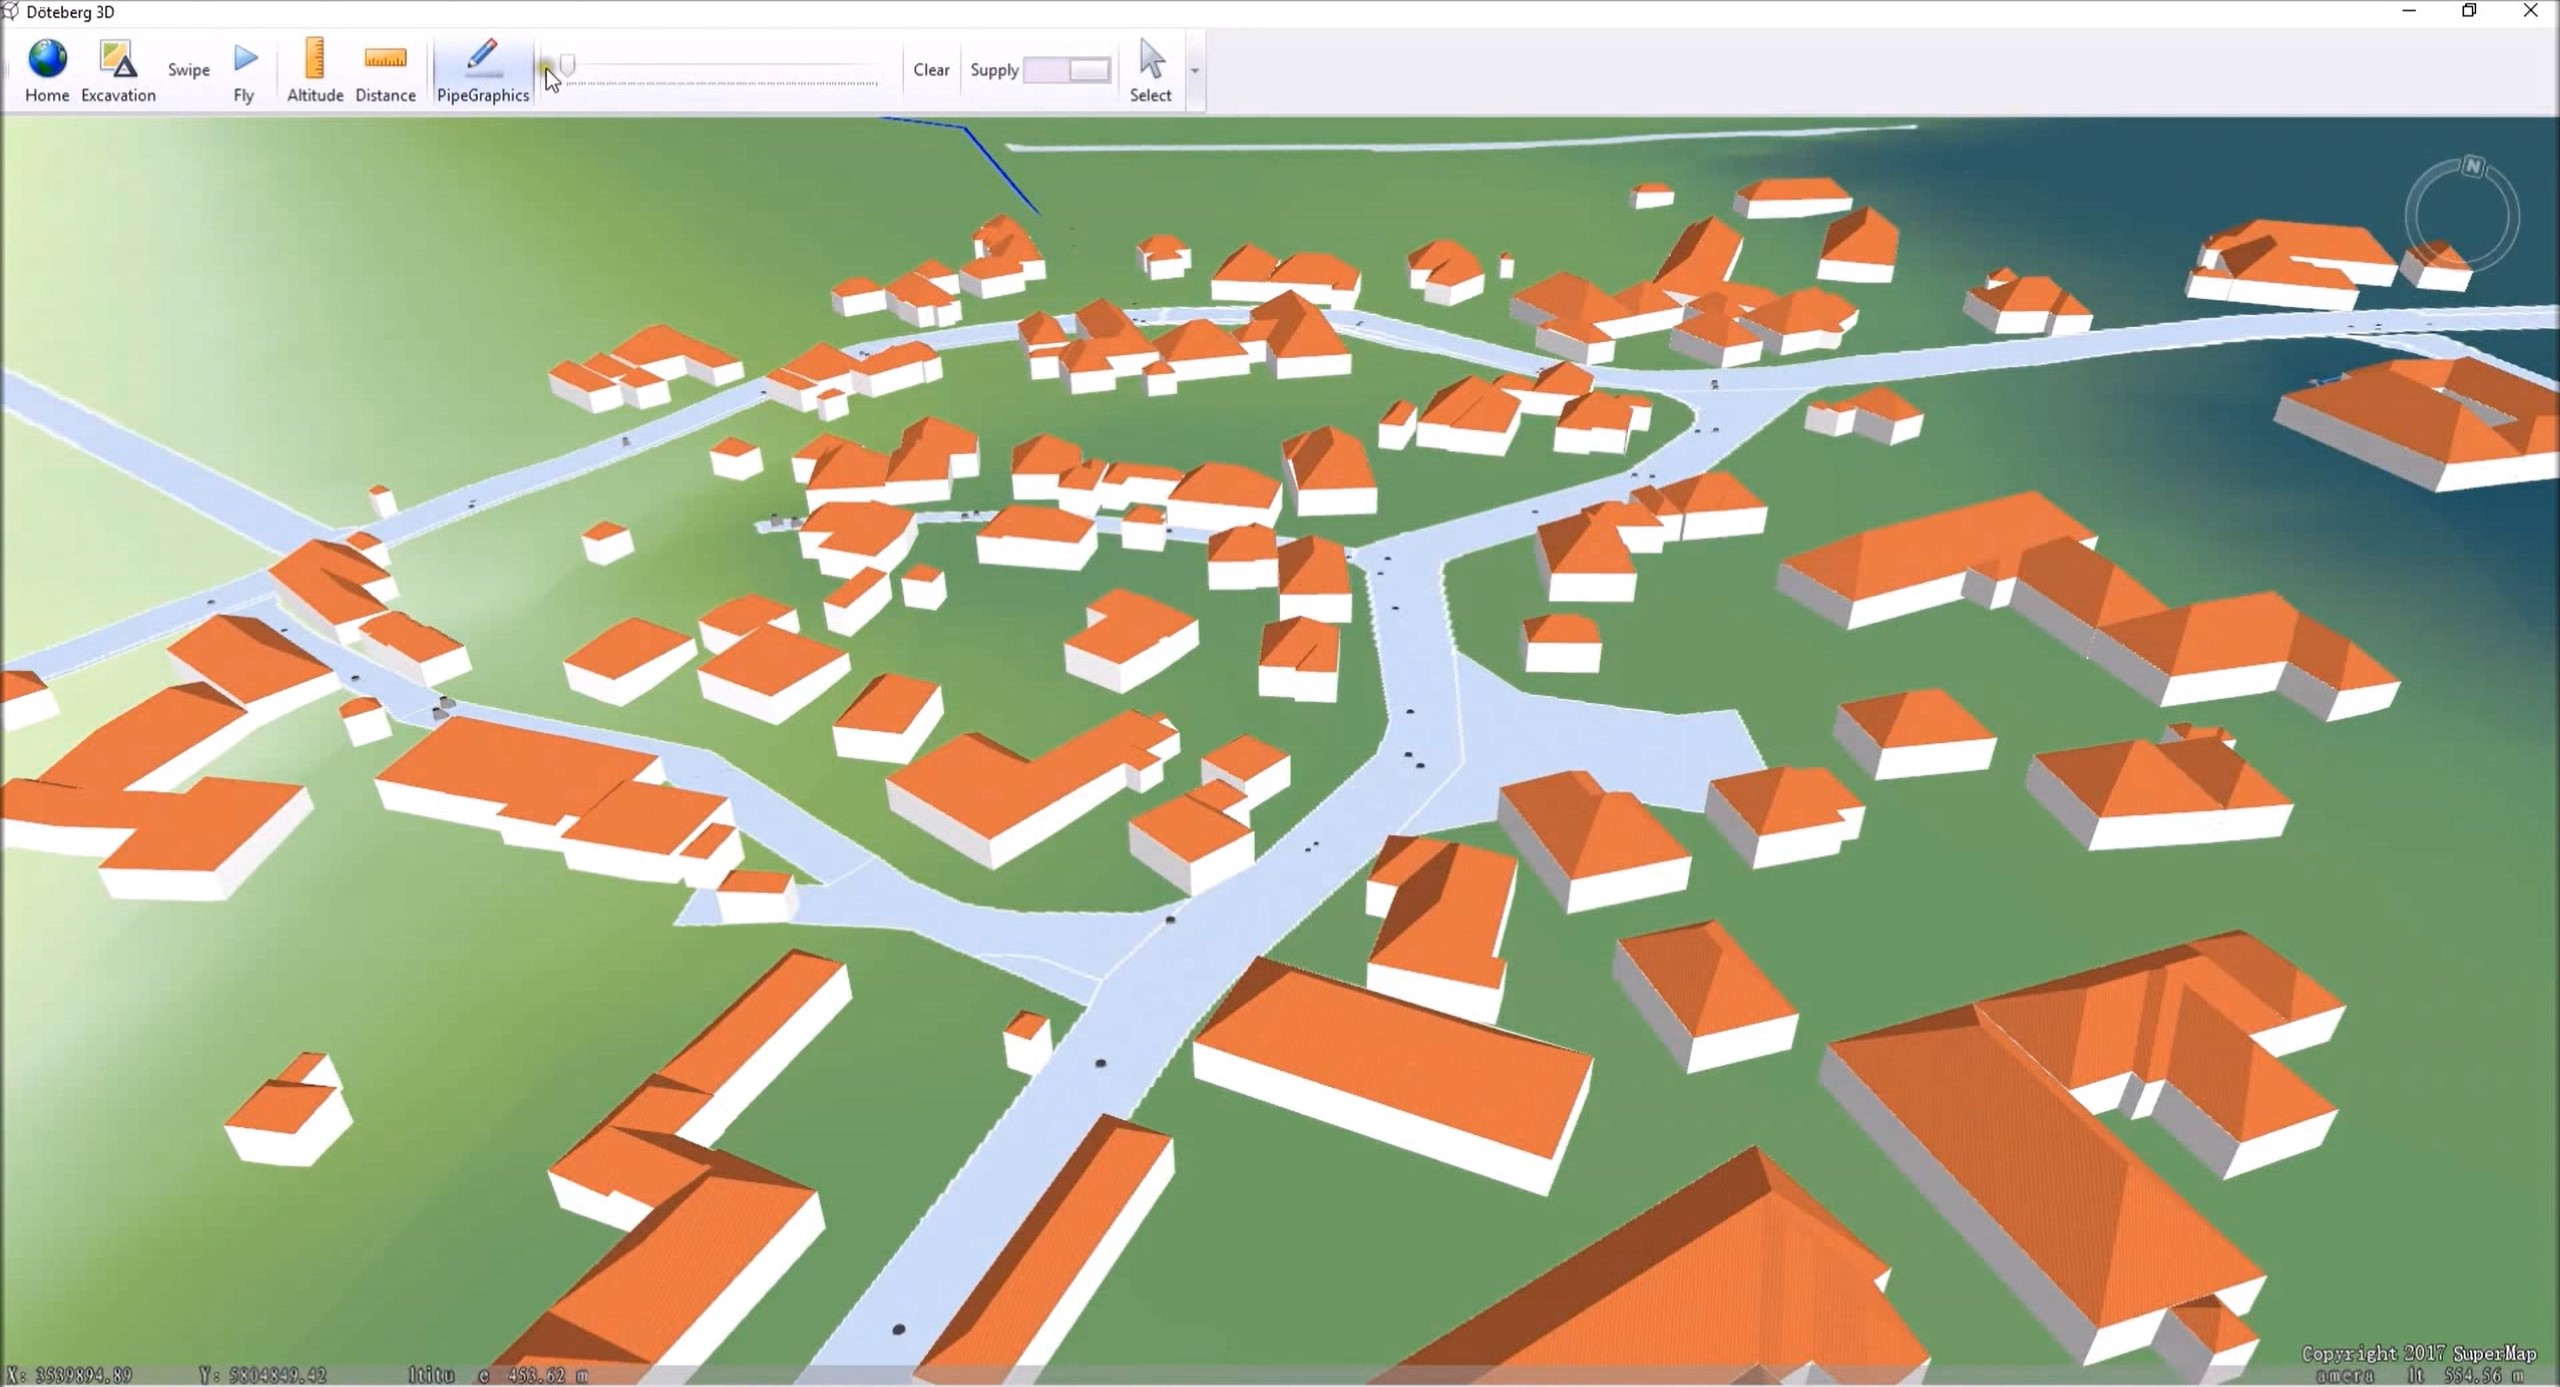
4.1 2D and 3D integrated display
This function supports browsing different pipeline data and aboveground and underground space data. It can load and remove pipeline layers in maps and scenes by checking the tree menu node in the layer control, and provide users with intuitive 2D and 3D data browsing functions.
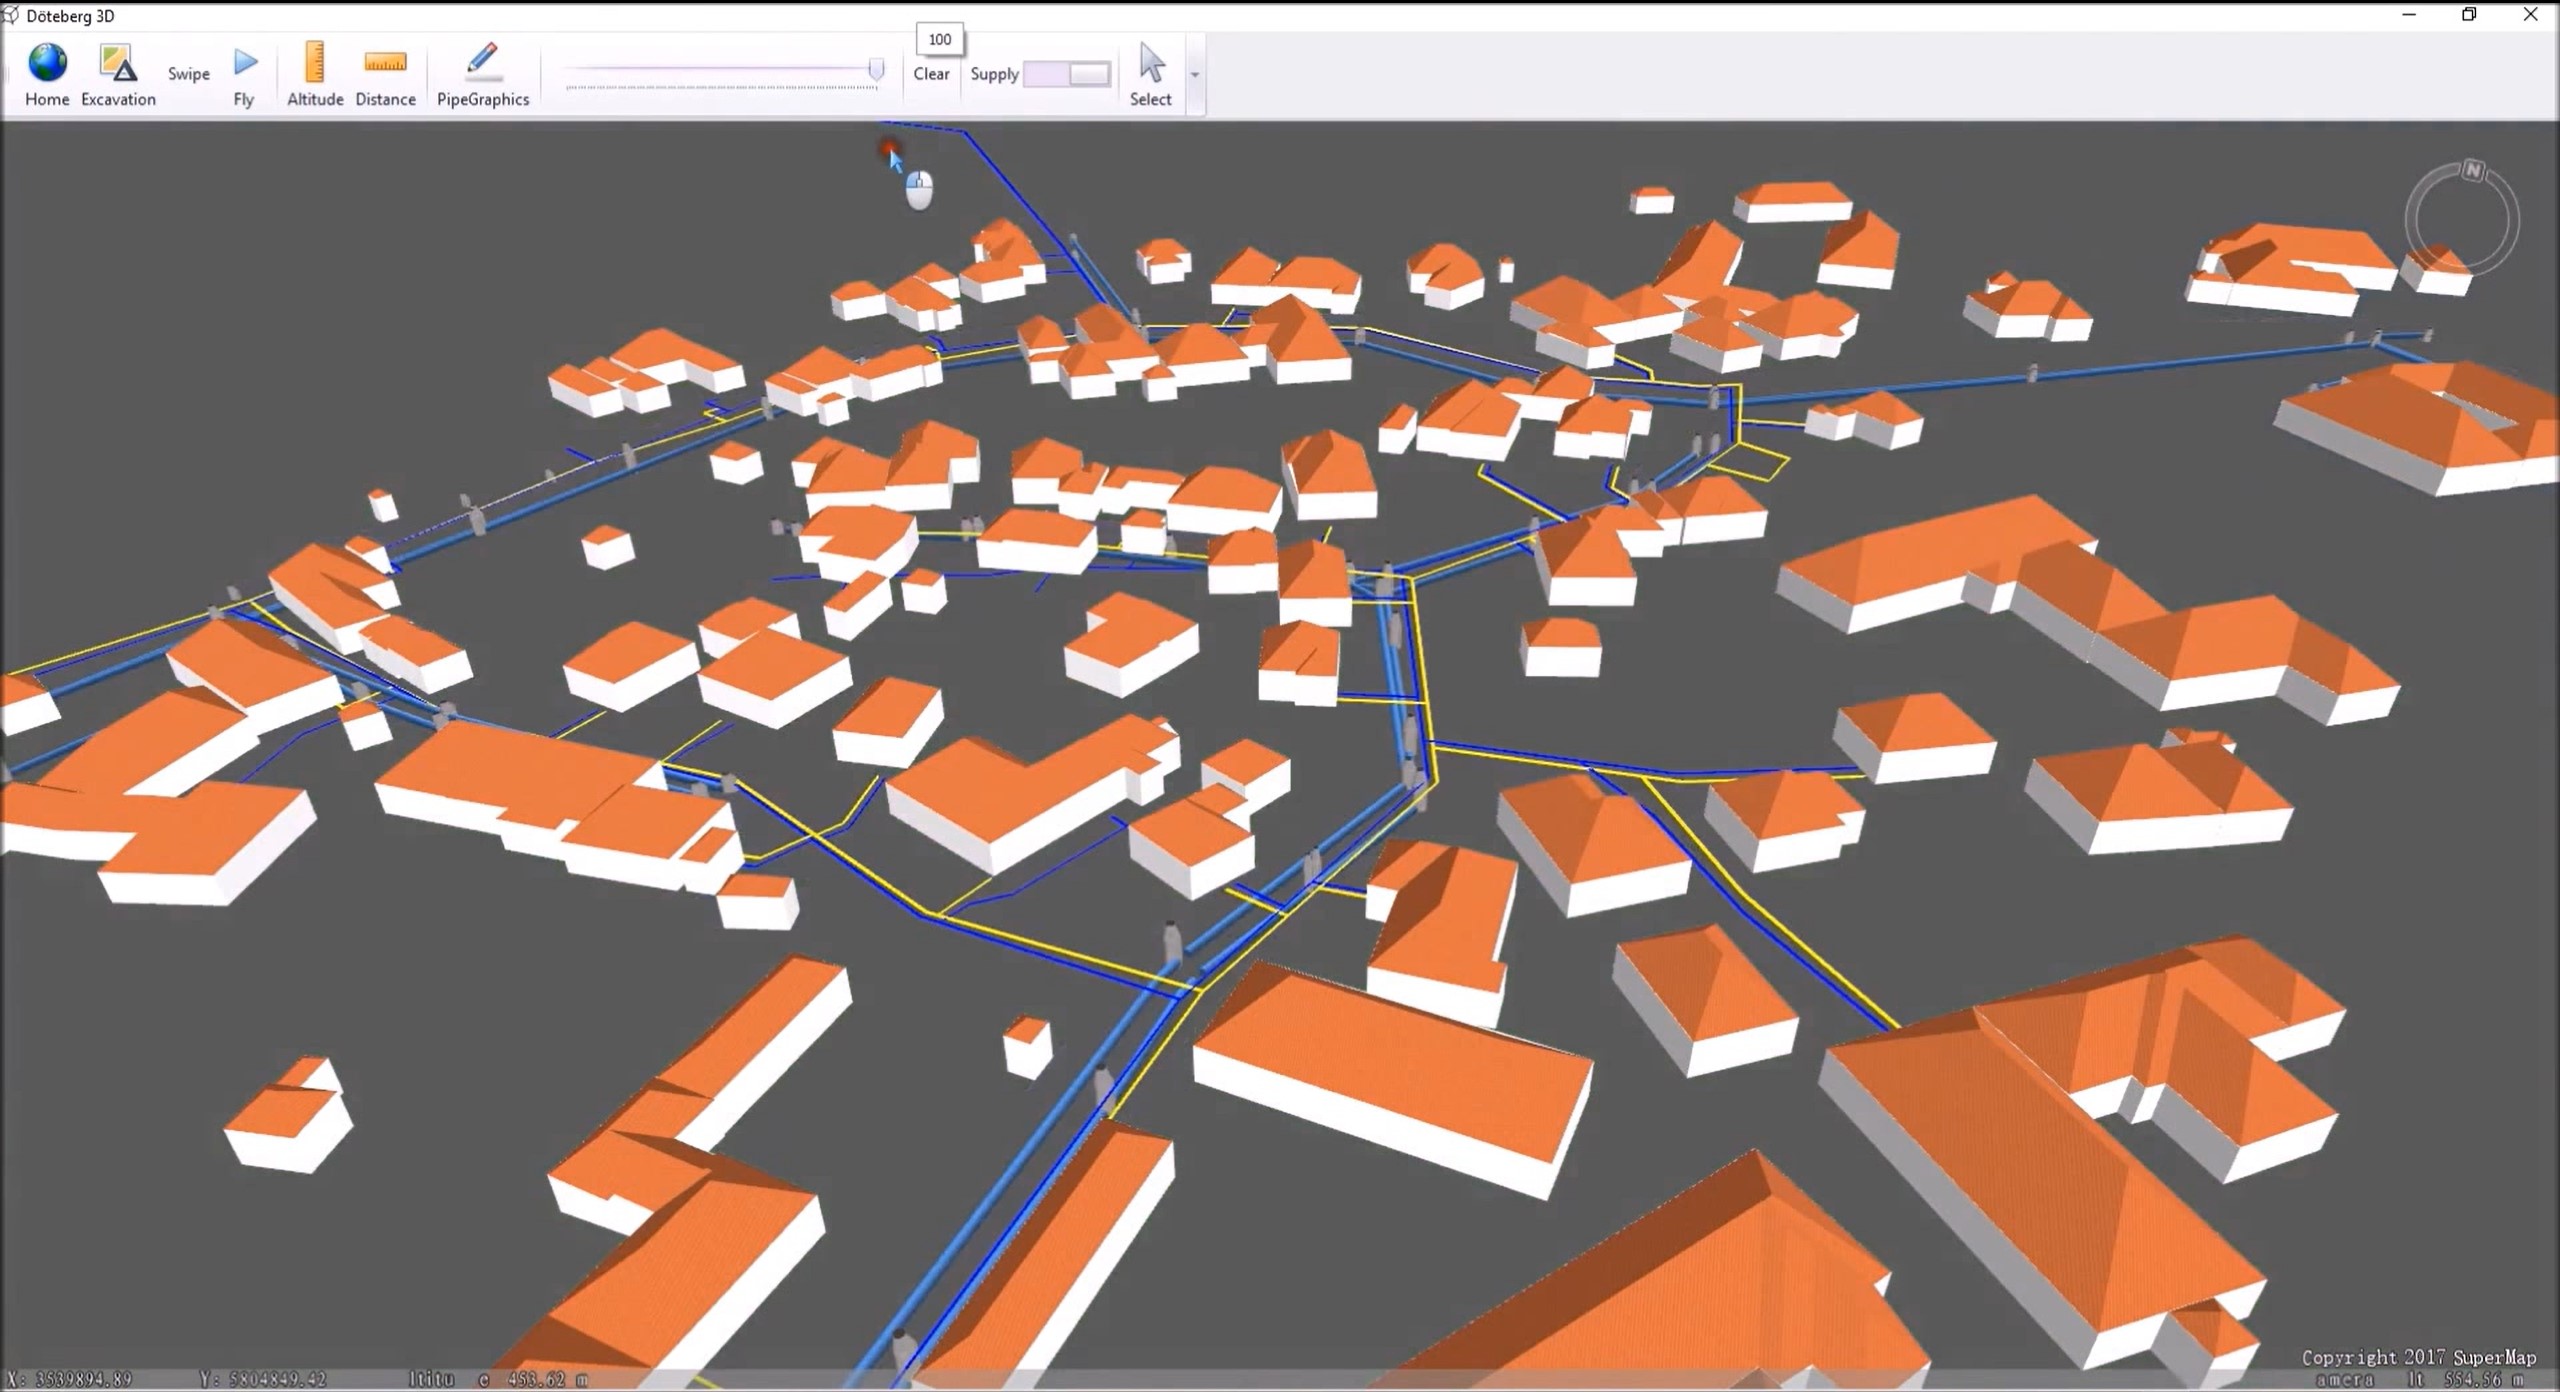
4.1.1 Transparency control of underground pipeline
This function can control the visible and hidden effects of underground pipelines by adjusting the transparency of the surface, so as to meet the needs of a variety of visual effects.
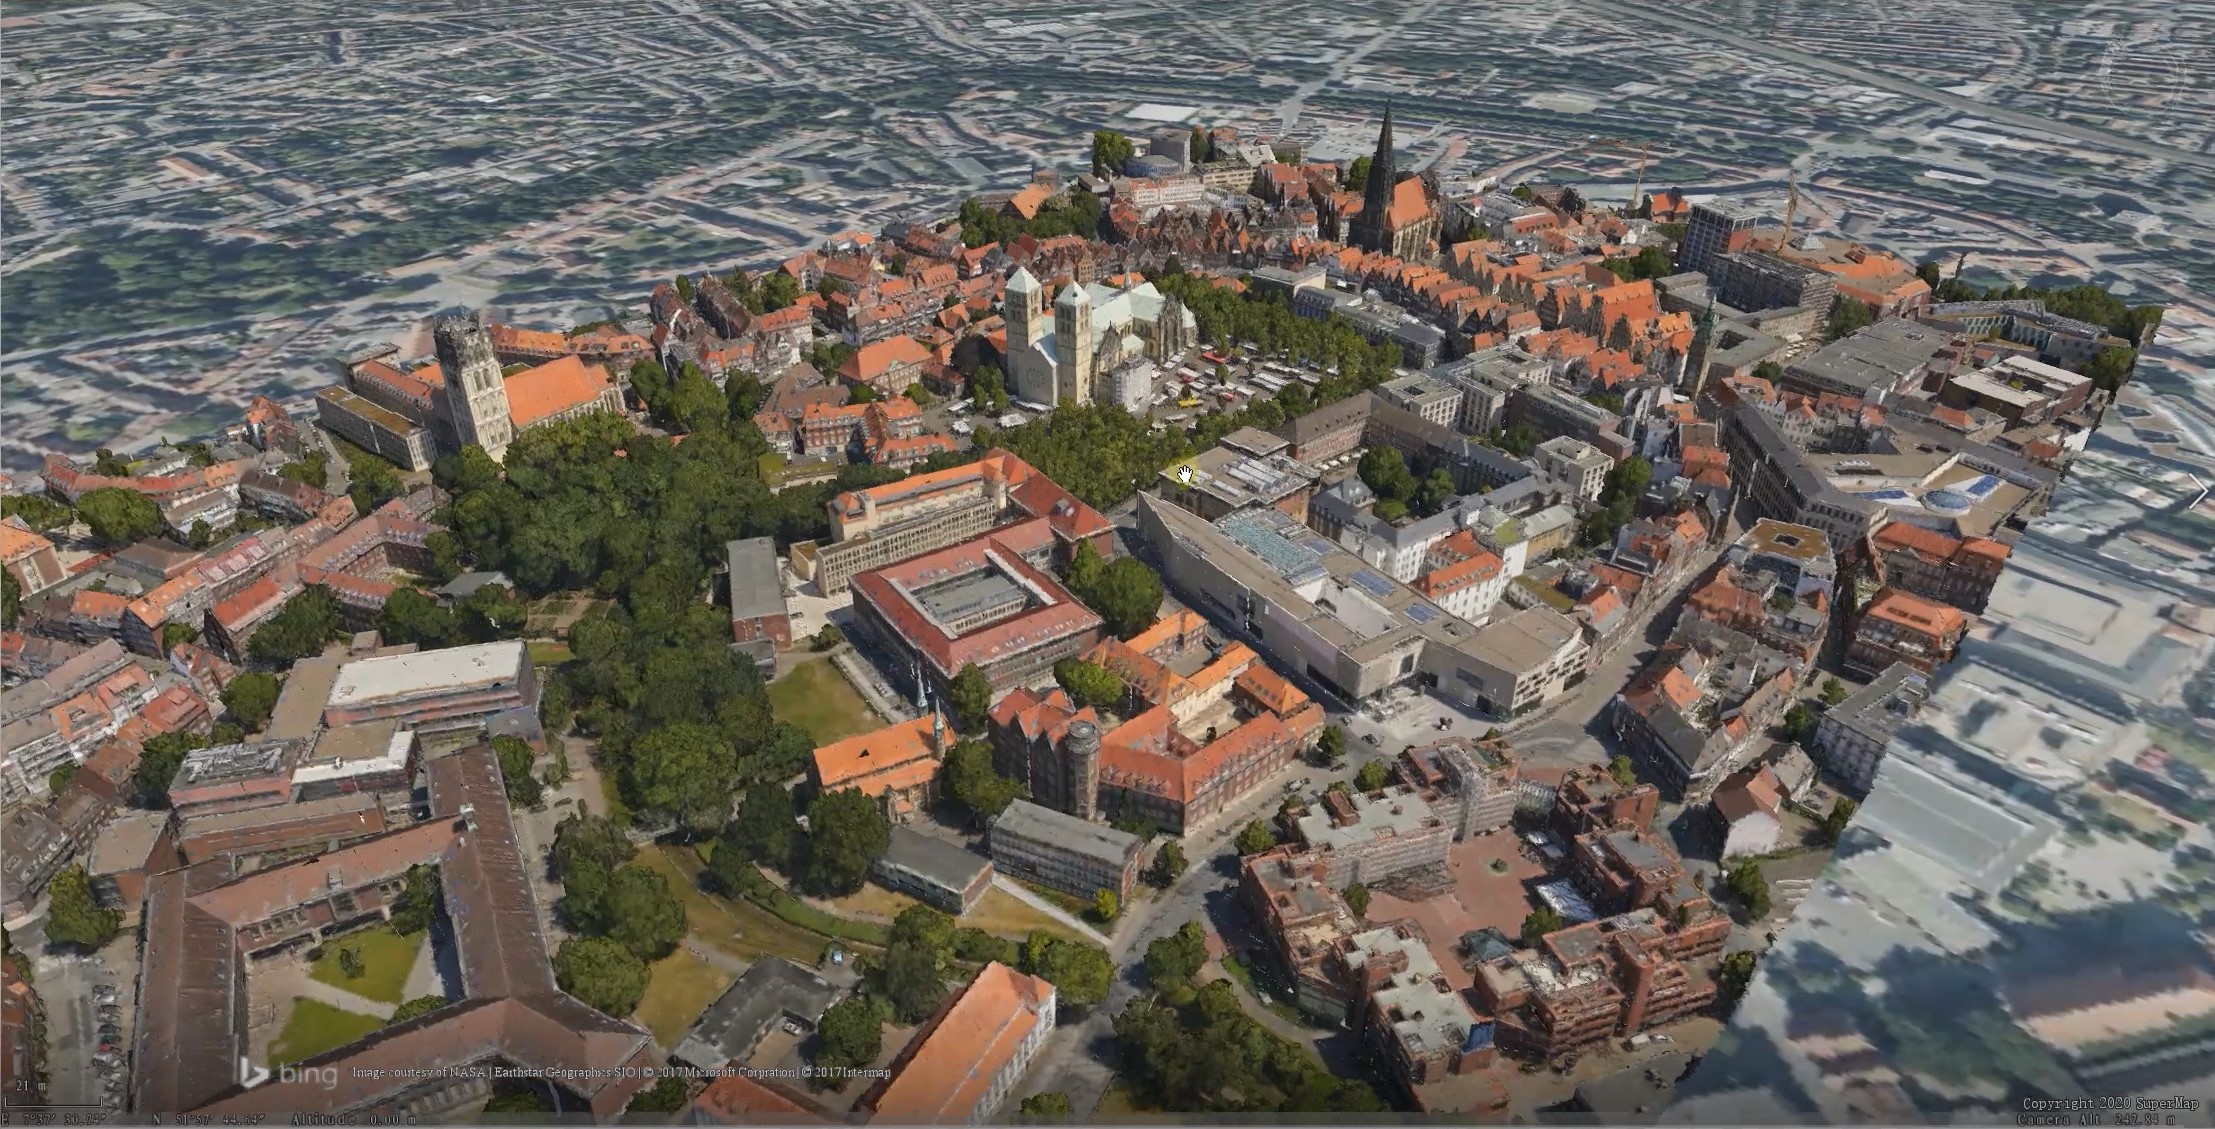
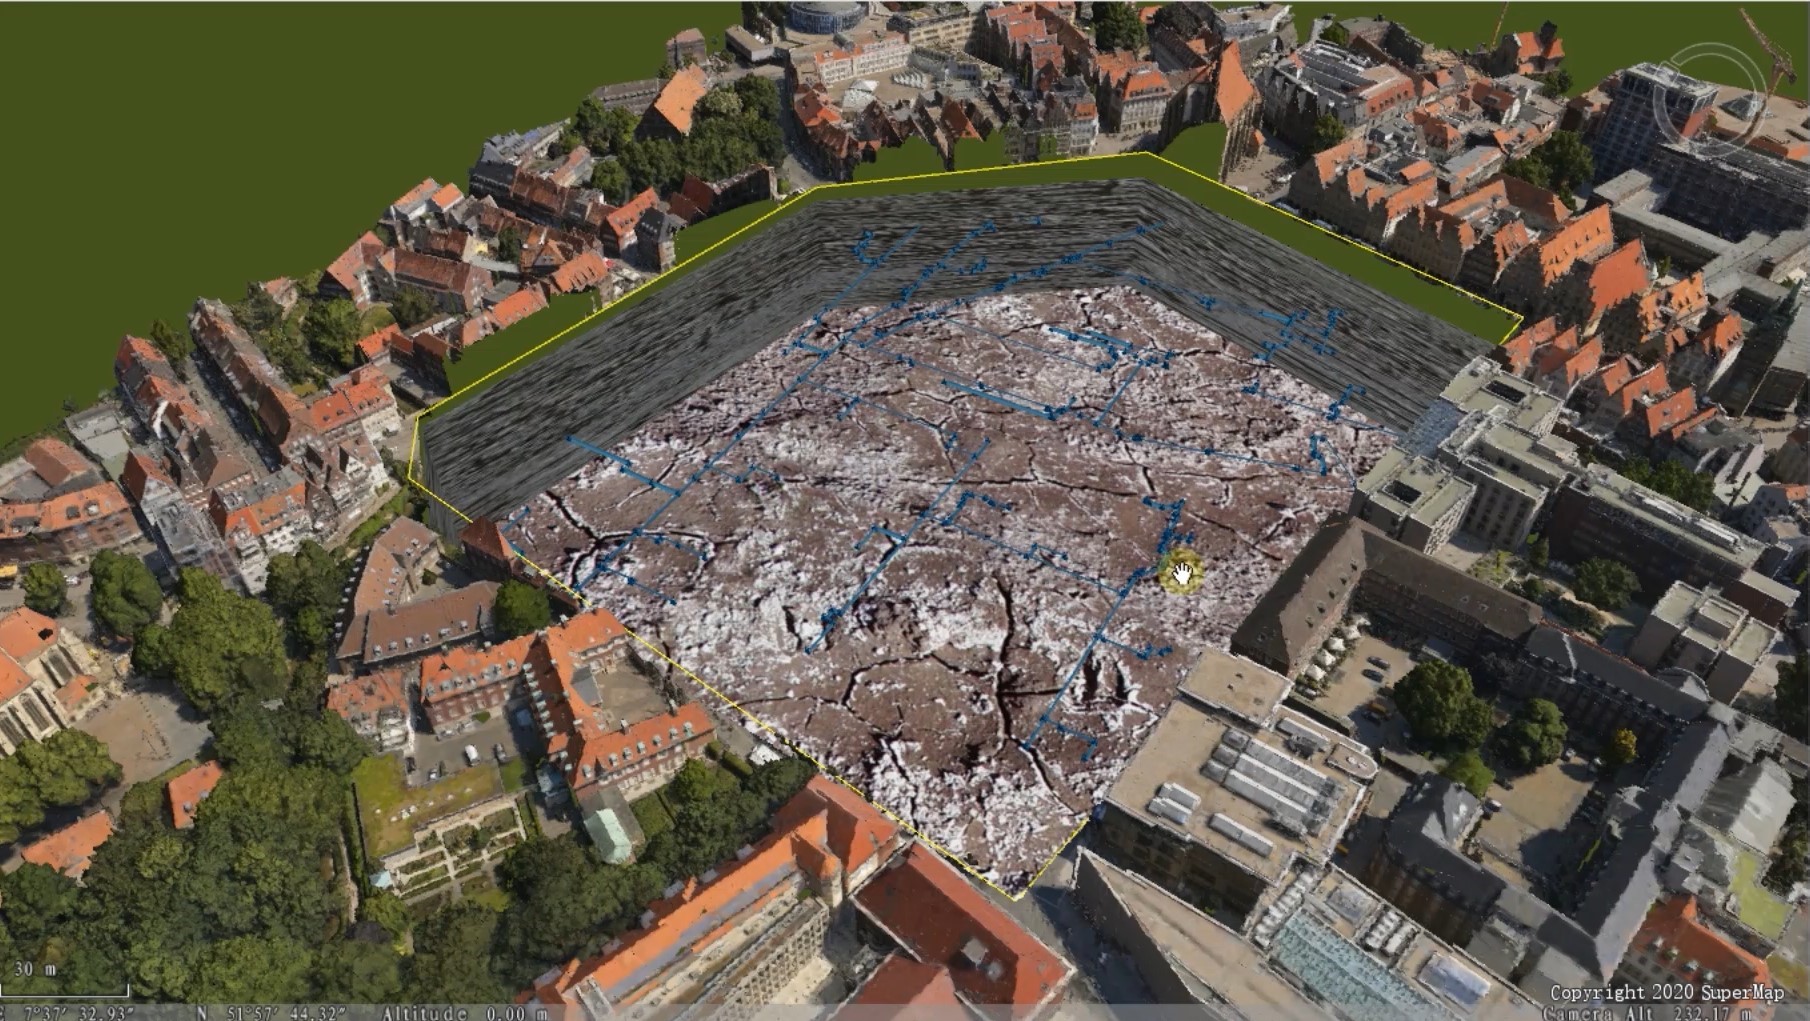
4.1.2 Overlay display with oblique photogrammetry data
When the pipeline is damaged and burst, this system can quickly locate the position and address of underground pipelines through the combination of oblique photogrammetry data. At the same time, it can also analyze the impact range and other information that may be brought to the surrounding areas, so as to carry out rapid visual guidance and accurate data analysis, and provide data and technical support for the rapid formulation of emergency decision making.
4.2 Pipeline information query
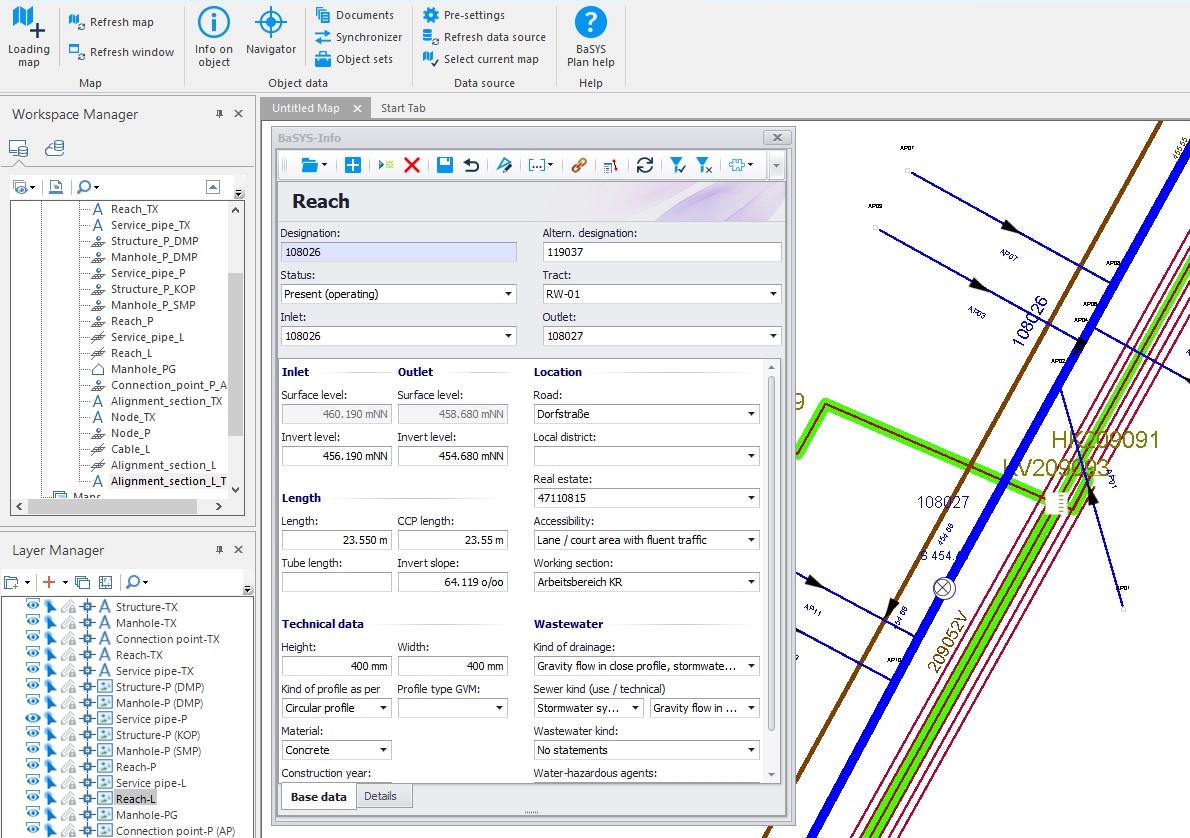
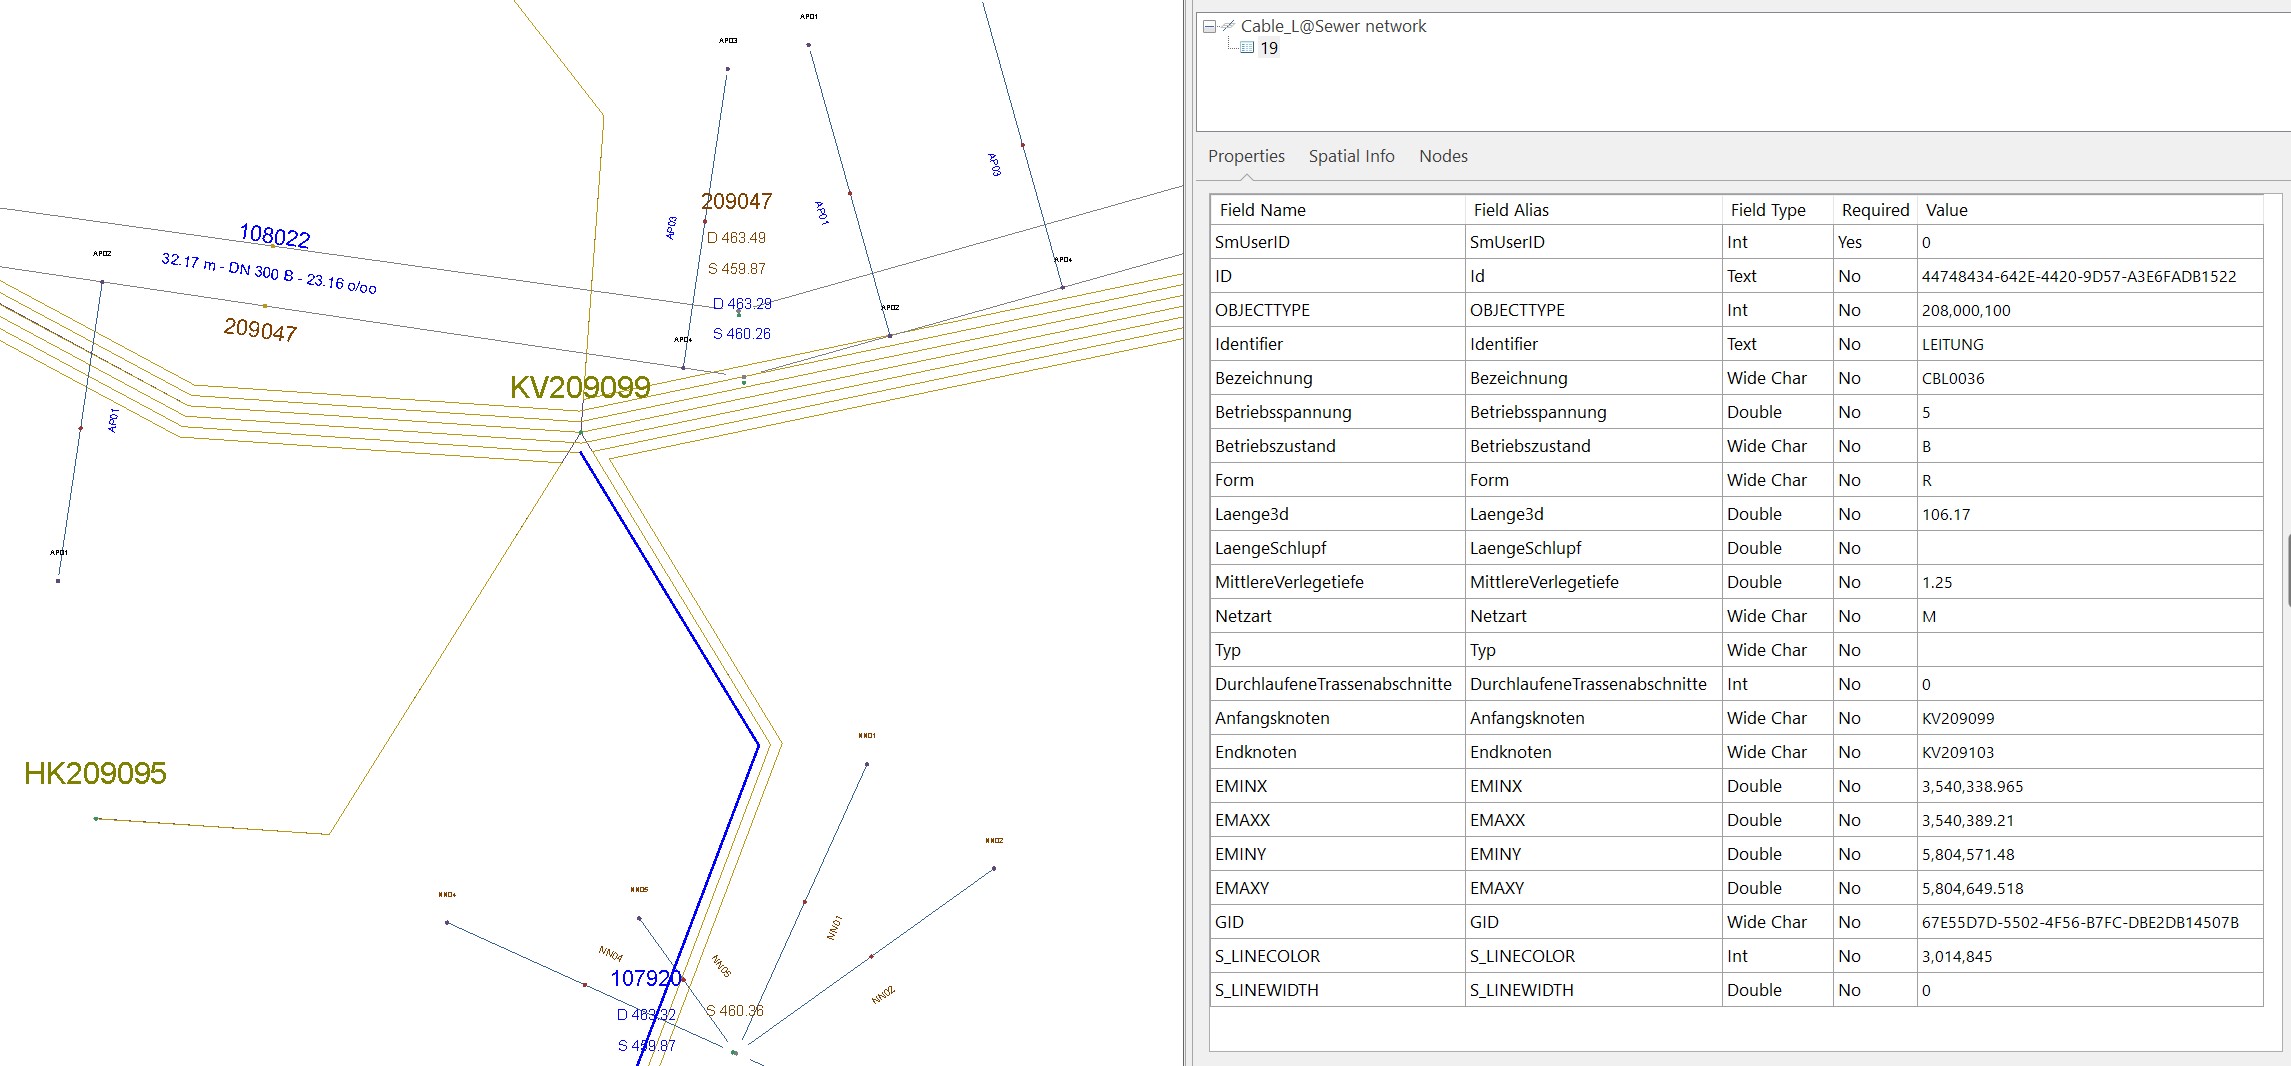
4.2.1 Attribute association query
By clicking and selecting pipeline facilities in a 2D map or 3D scene, the query of pipeline category, pipe diameter, material, embedding date, characteristics and other information can be implemented, and the attribute information can be modified. Meanwhile, the query results can also be exported into required forms or different types of statistical charts.
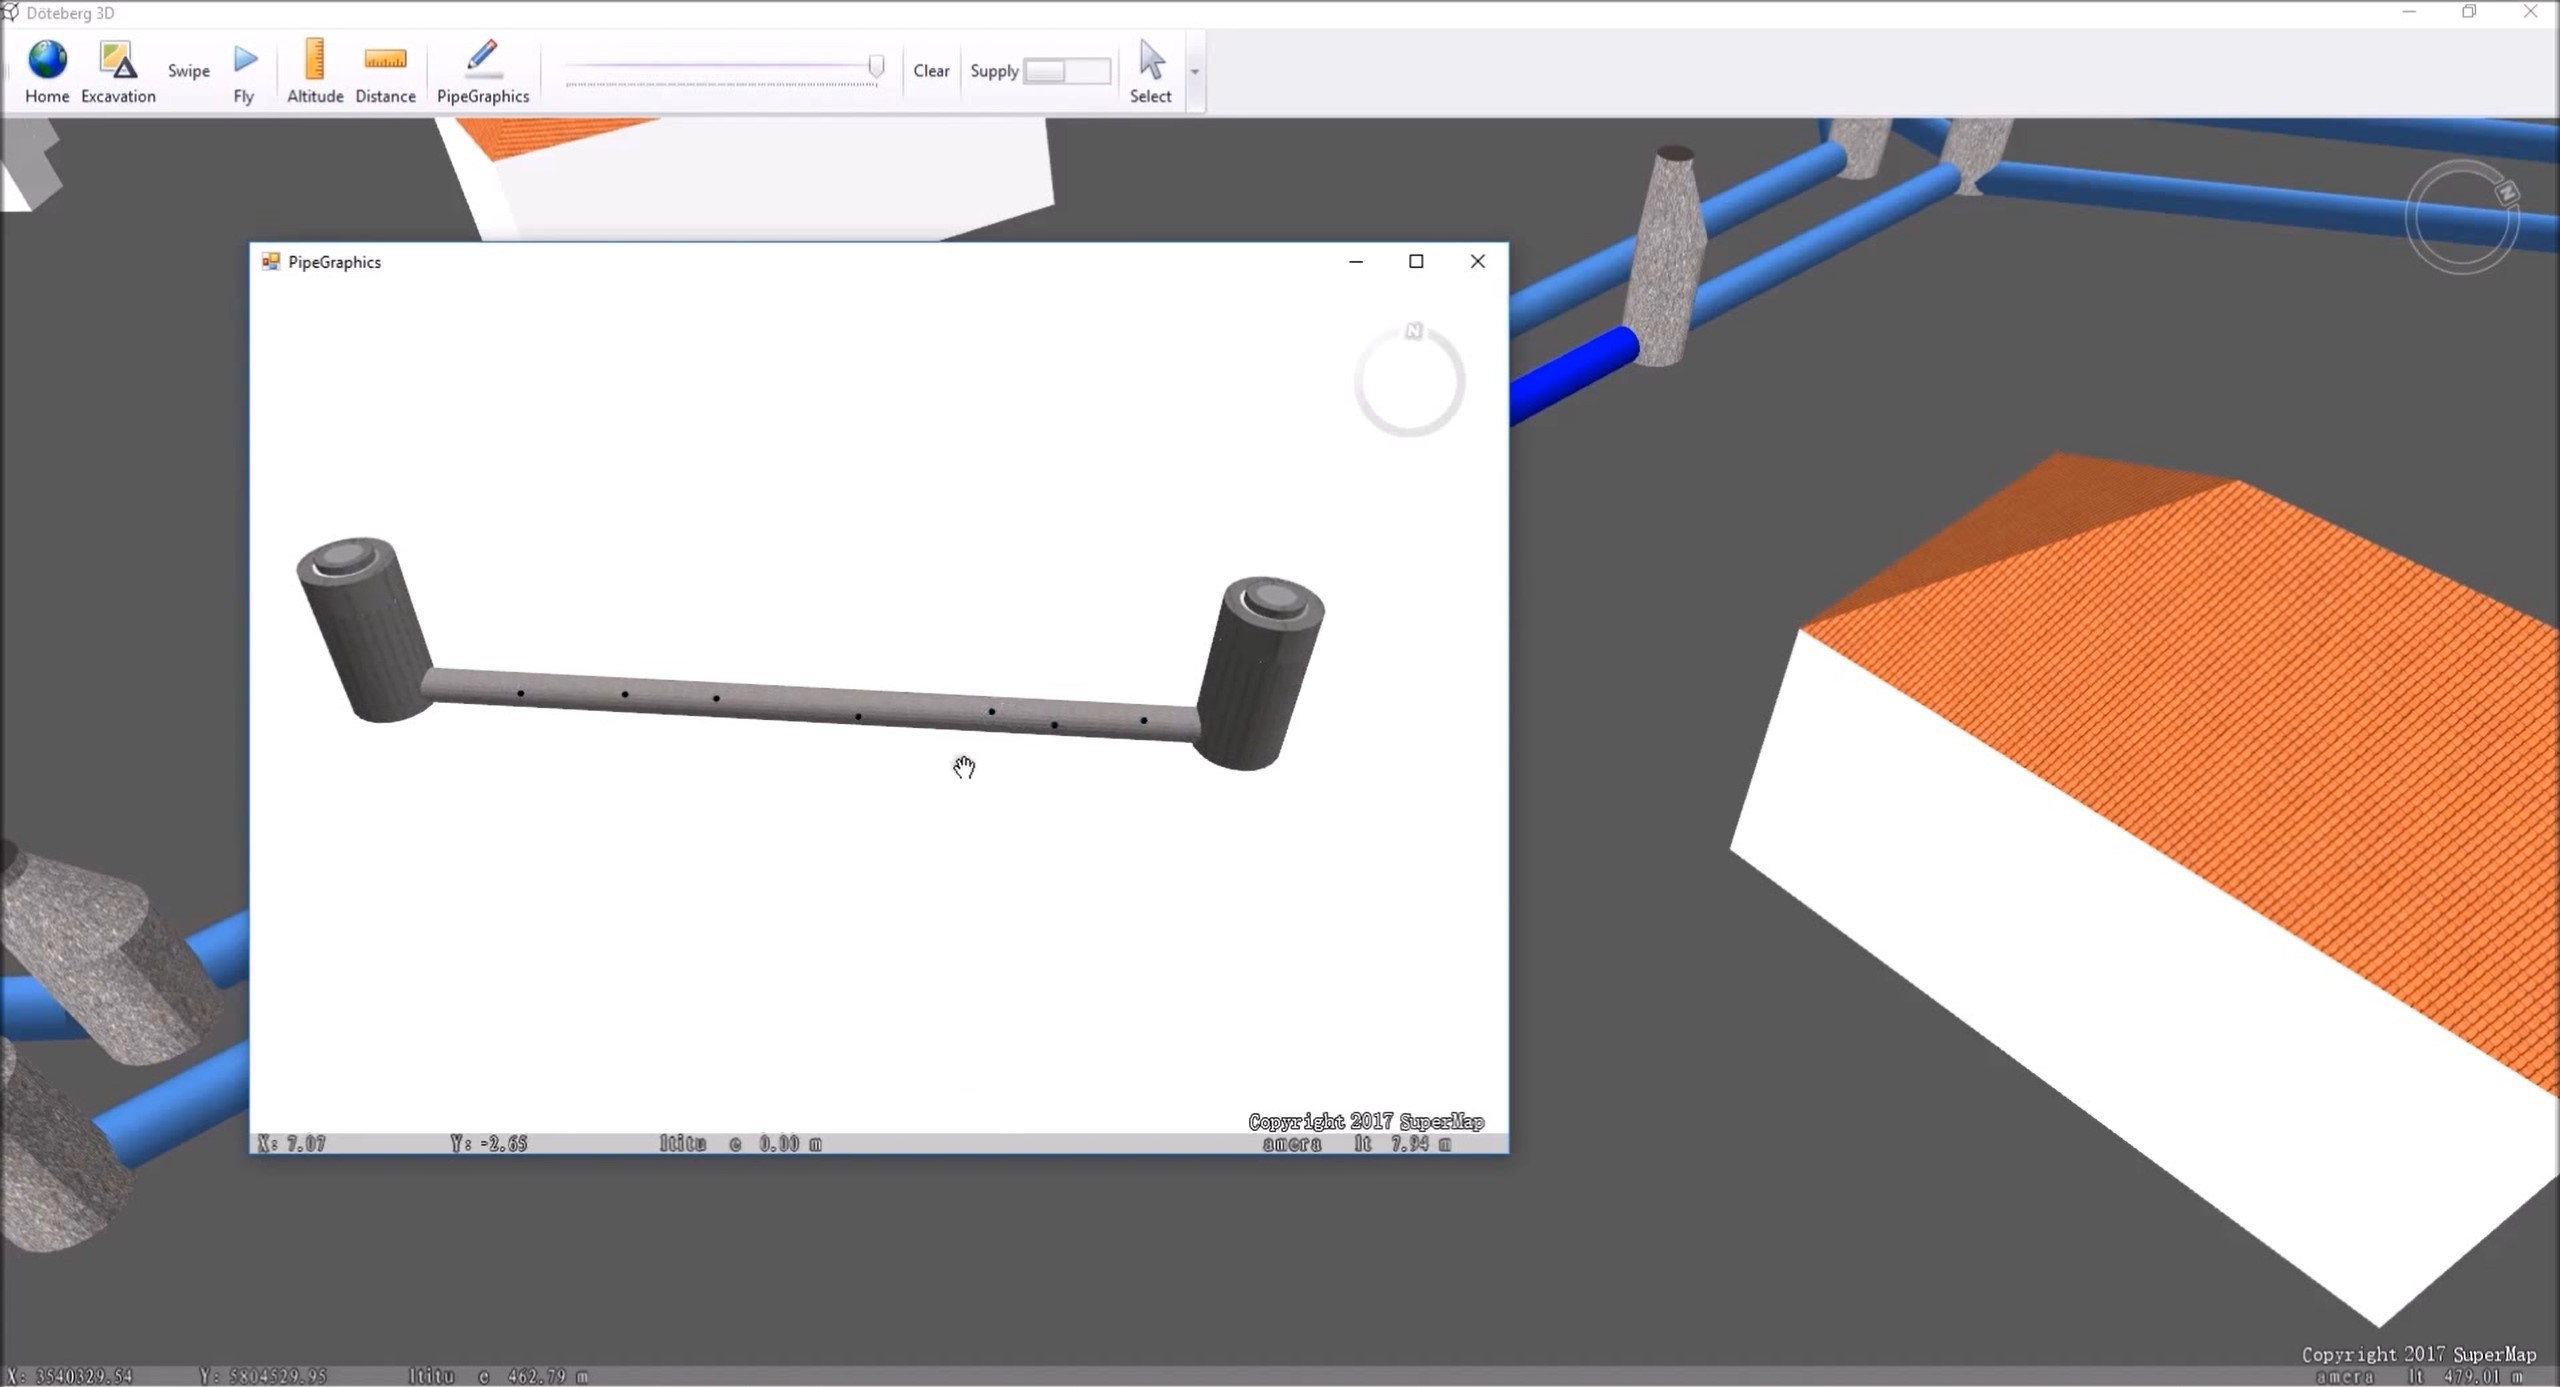
4.2.2 3D model or drawing association query
The associated query can be carried out by associating the original pipeline and facility drawings or 3D models, so as to facilitate users’ view of the original status information of pipeline and facilities.
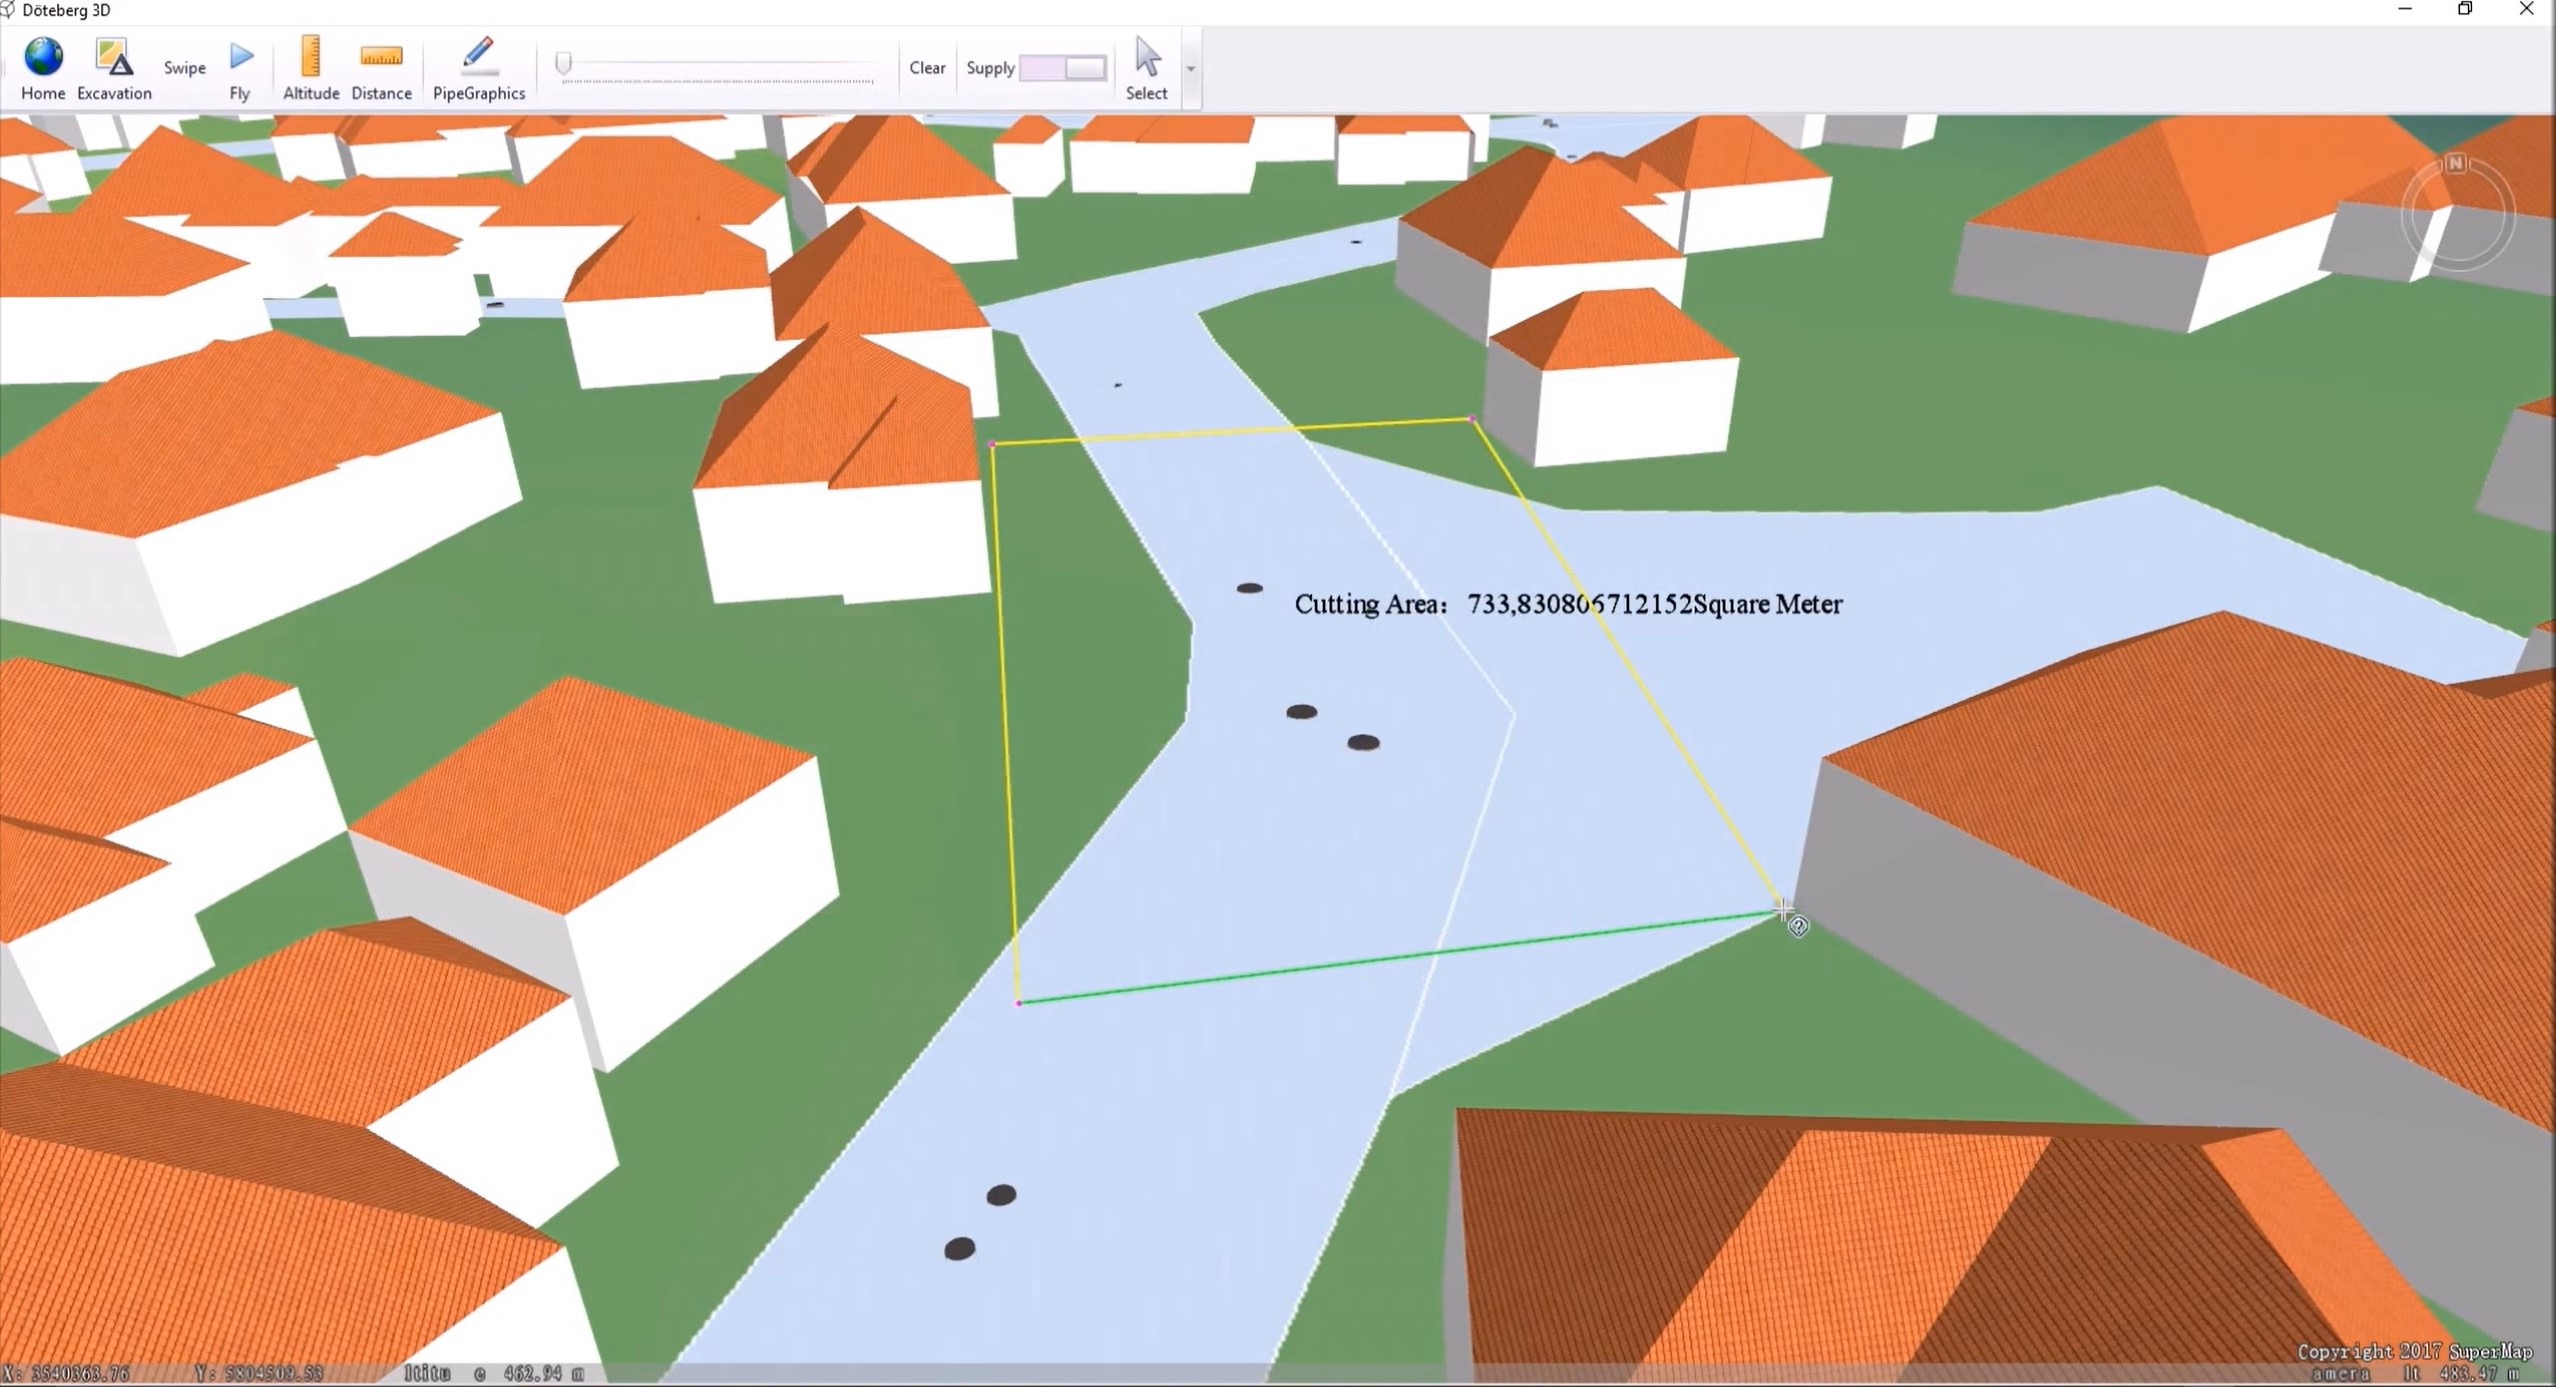
4.3 3D measurement of pipeline
The spatial measurement function enables users to quickly calculate the distance between pipelines or the area of the ground area to be excavated. This function includes distance measurement and area measurement. “Distance measurement” supports the measurement of pipeline space distance and pipeline distance according to the ground. “Area measurement” refers to area measurement based on land area and object area.
4.4 3D pipeline facilities analysis
SuperMap 3D pipeline technology provides facilities network analysis functions, including connectivity analysis, tube burst analysis, tracking analysis, etc. It can achieve the rapid positioning of pipeline facilities and emergency disposal, and analyze the information of surrounding affected areas and population, so as to provide a guarantee for urban emergency rescue and auxiliary decision-making.
4.4.1 Connectivity analysis
Connectivity analysis can judge the connection relations between specified two points in the pipeline, and can be analyzed based on parameters such as the location, connection quantity and flow direction of the pipeline. For example, it can be used to judge the connectivity between two specified valves in underground pipelines.
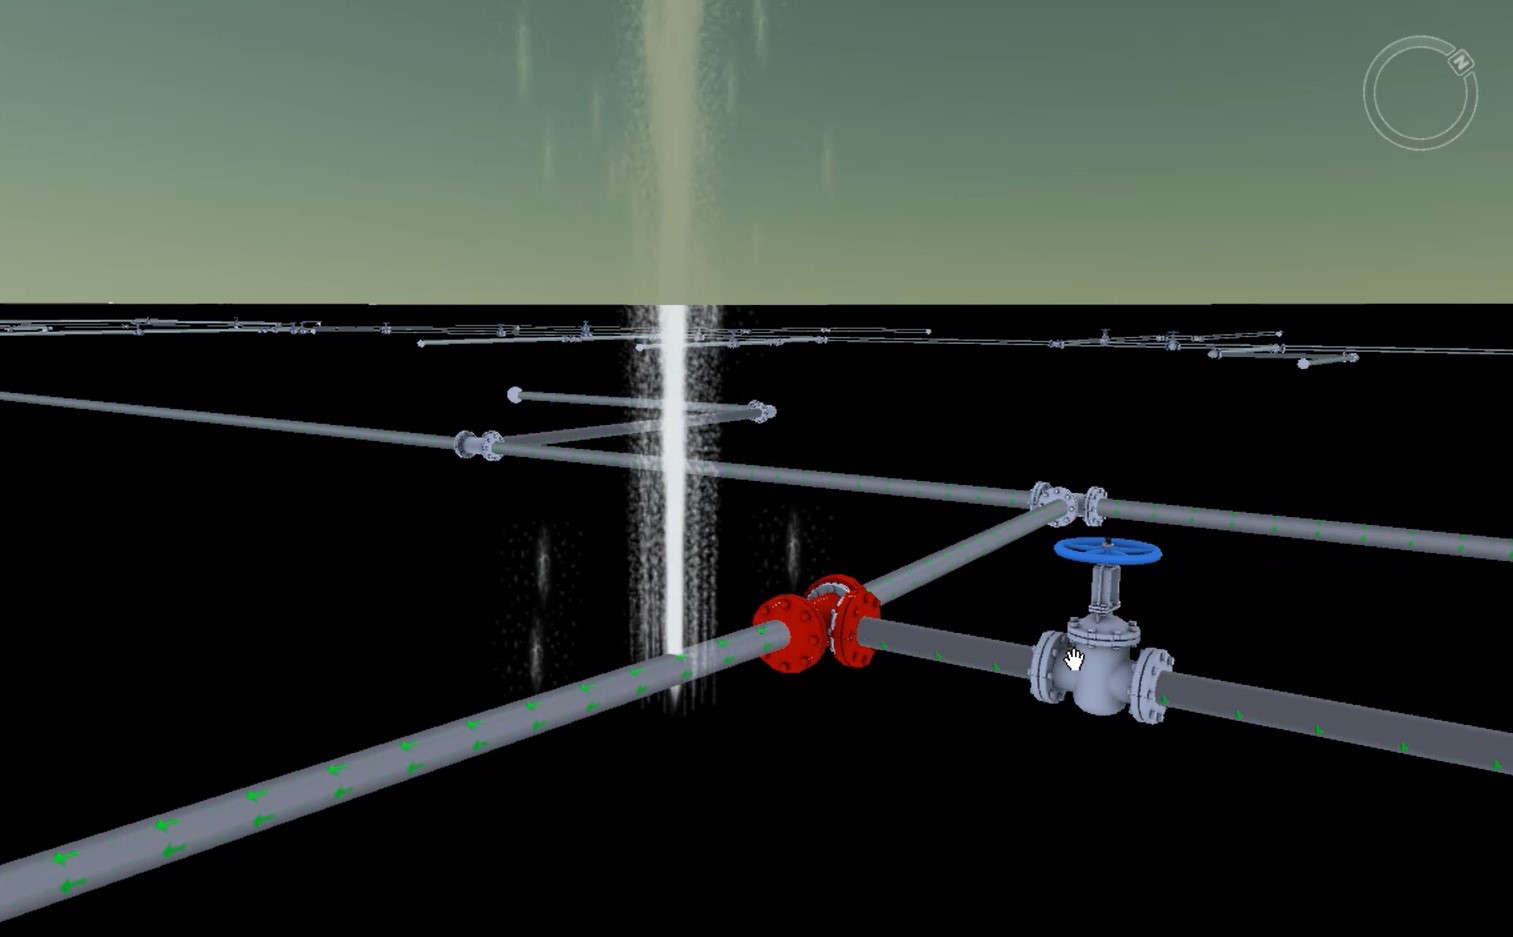
4.4.2 Tube burst analysis
According to the spatial topological relationship of the pipeline at the accident site, the tube burst analysis can quickly query the upstream valves to be closed and the affected downstream pipelines. Also, the valve to be closed and the user information affected by water cut-off can be output into a form.
4.5 Aided decision making based on 3D spatial analysis
SuperMap GIS 3D spatial analysis supports buffer zone analysis, excavation analysis, pipeline cross-section analysis, etc., in 3D pipeline management.
4.5.1 Buffer analysis
Buffer analysis can be used to view the information of pipe points, pipelines and other facilities within the specified range of the object. For example, when reconstructing a designated area, information about the surrounding affected pipelines is required.
4.5.2 Excavation analysis
The terrain or oblique photogrammetry model can be excavated in the 3D scene, so as to view the distribution of the underground pipeli
Tags:3D GIS