In the daily work of big data era, users often borthered by the form of data expression. For instance, large amount of data, different kinds of data, data presentation styles, and layout of charts always delay time and fail to show effective results.
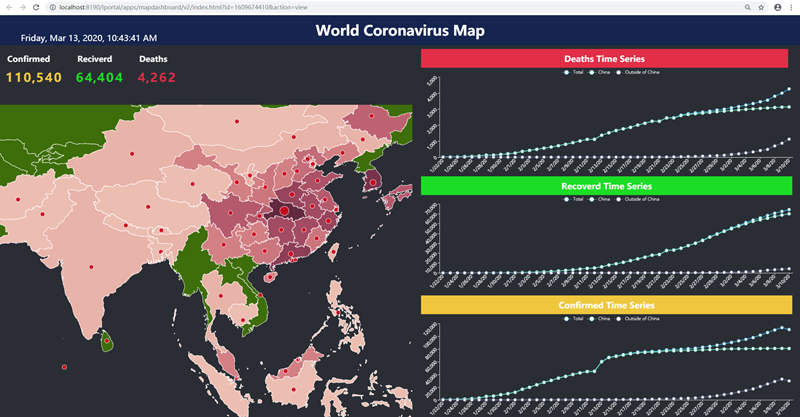
As coronavirus becoming a world-concerned topic recently, governments and companies in countries have set up their own coronavirus dashboard. Do you want to make your own one by using SuperMap iPortal Web APP?
The SuperMap iPortal provides you with the out-of-the-box SuperMap iPortal WEBAPP - MapDashboard. It provides users with convenient drag and drop components and can easily build a beautiful dashboard. Mapdashboard can show the charm of GIS spatiotemporal data visualization. At the same time, it can help GISer easily build a web dashboard application with a professional map, support a variety of data types, and meet your different visualization needs. Just move the mouse like making PPT, you can get a beautiful dashboard.
Now follow me to create your own coronavirus dashboard. Or you can watch the operation tutorial from:

1. Software Preparation
We need to download and configure SuperMap iServer, SuperMap iServer Datastore and SuperMap iPortal to establish our own GIS cloud platform. We only need to do it once and in the future we can use them directly and make different dashboard.
(1) Download link:
iServer:
https://drive.google.com/open?id=1BMvfu1hS99lbLYs8x5rZrauP3COmijY5
iServer Datastore:
https://drive.google.com/open?id=1BHbsWKplbC5-Wxpi-B0QJghSAdKtzCEk
iPortal:
https://drive.google.com/open?id=1OzBoKiTmsJkEhcRR9g304GPbBr5a94tC
(2) Configuration
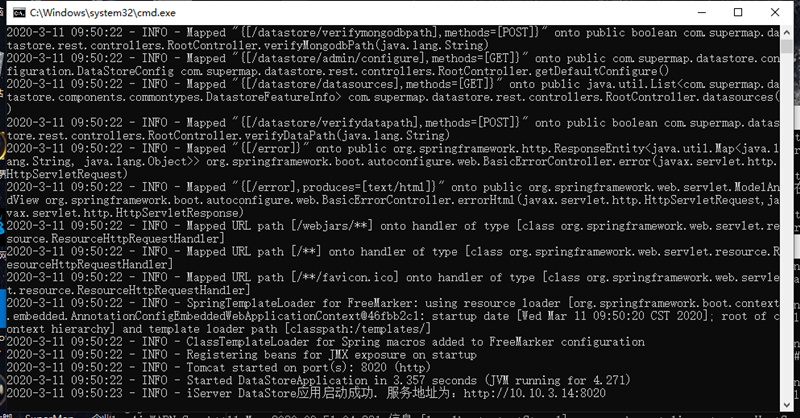
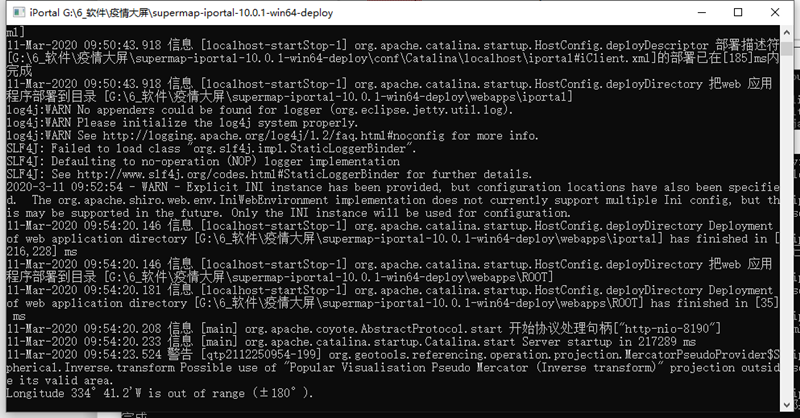
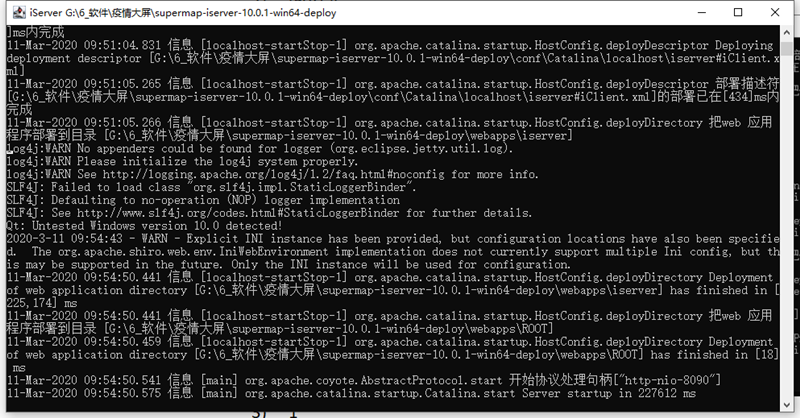
A: Startup all these three products.
1) iServer Datastore:
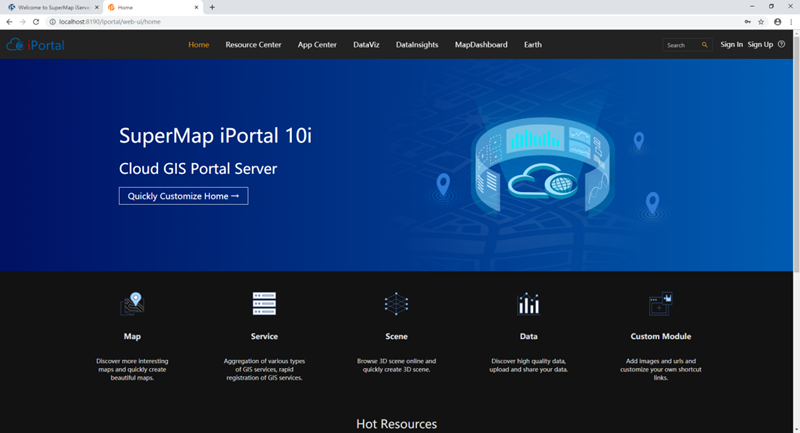
2) iPortal:
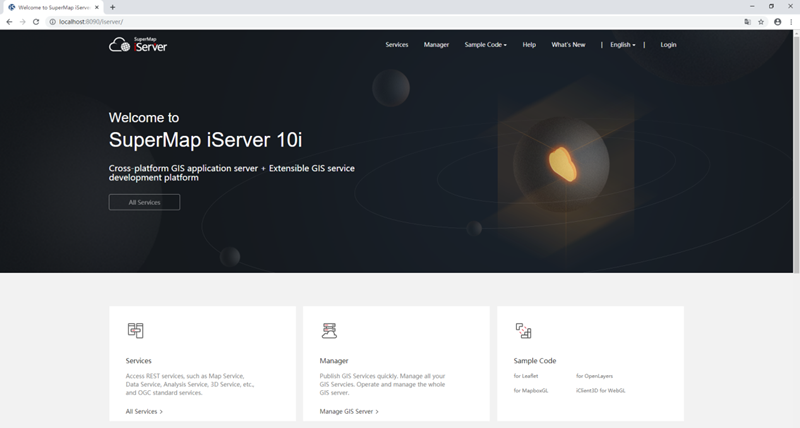
3) iServer:
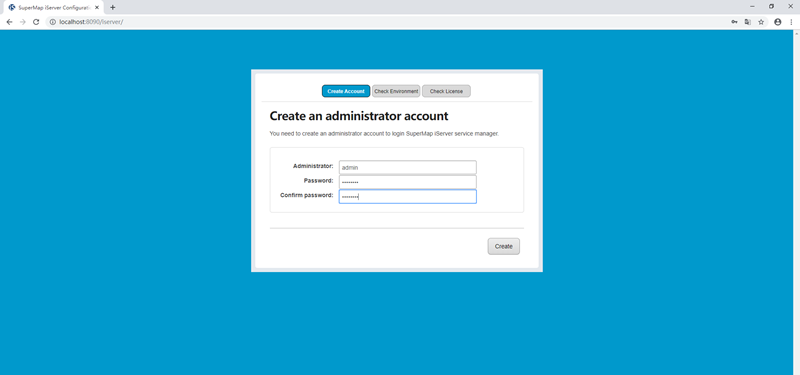
B: Visit the home page of iServer at http://localhost:8090, then create administrator account.
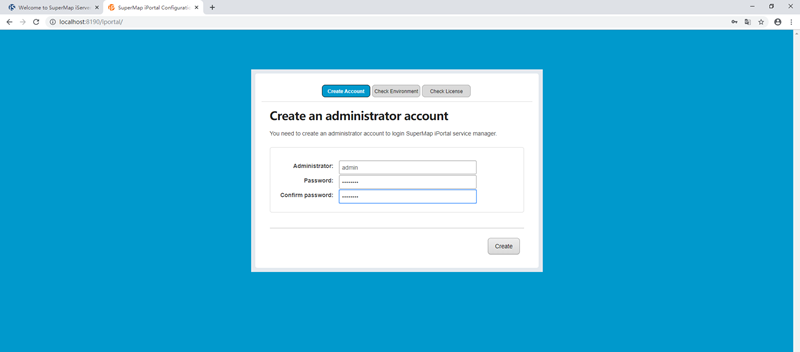
C: Visit the home page of iPortal at http://localhost:8190, then create administrator account.
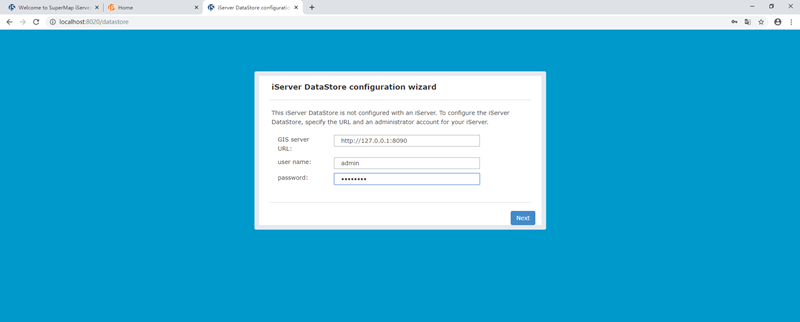
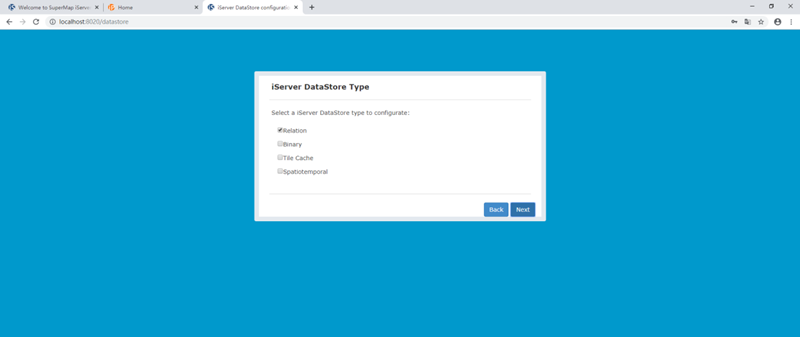
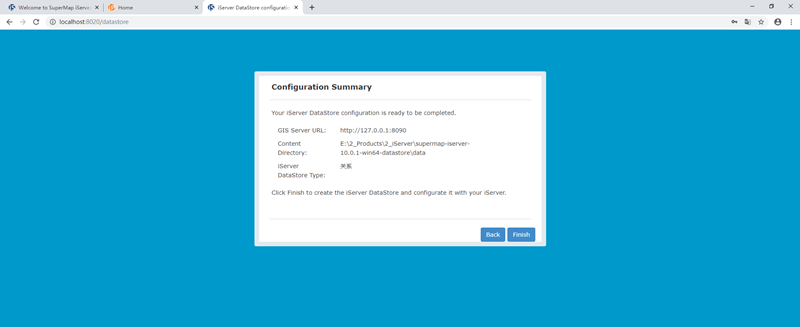
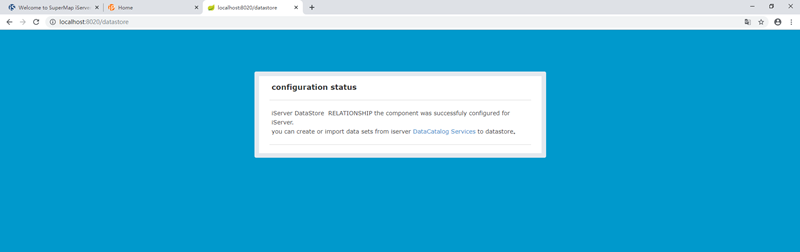
D: Visit the home page of iServer Datastore at http://localhost:8020, then configure iServer path, administrator account, content directory (keep default is ok), and datastore type (Relation).

E: Configure iServer as host server of iPortal.
1) Go back to the homepage of iPortal, login with administrator account, then go to management page.

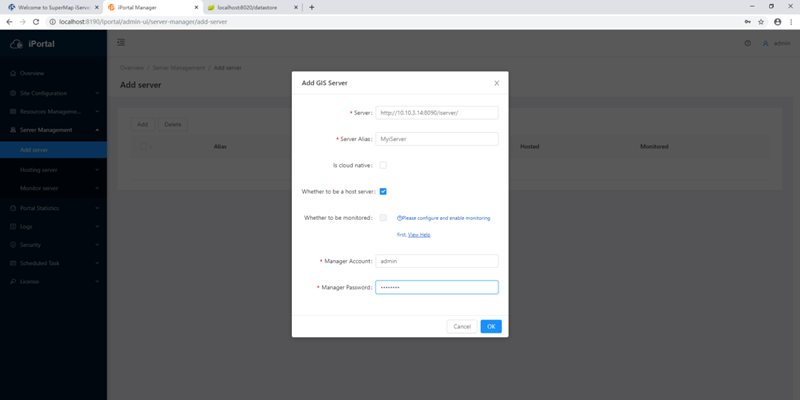
2) Go to Server Management and click Add server.
a. Server: Input the url of iServer home page.
b. Server Alias: The alias of this iServer.
c. Whether to be a host server: Check the checkbox.
d. Manager Account: Administrator username of iServer
e. Manager Password: Administrator password of iServer
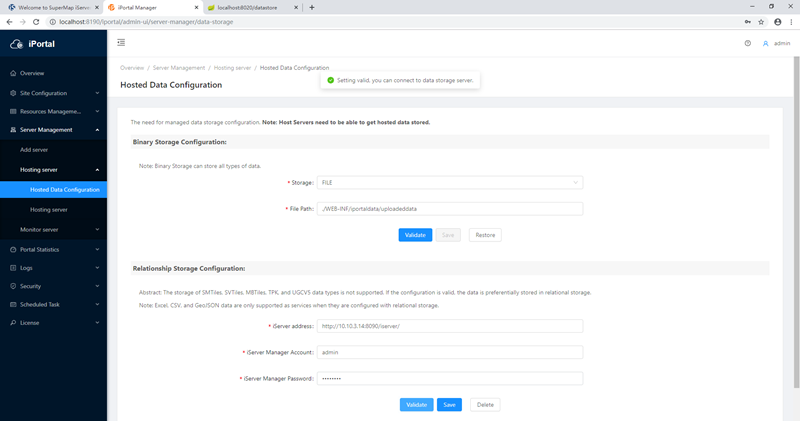
3) Go the Server Management -> Hosting Server -> Hosted Data Configuration, set the Relationship Storage Configuration.
a. iServer address: The url of iServer.
b. iServer Manager Account: Administrator user name of iServer.
c. iServer Manager password: Administrator password of iServer.
d. Then click Validate and save.
F: Now we have finished all required configuration to build the dashboard. This configuration only need to be done once when we first start iServer, iPortal and iServer Datastore.
2. Data preparation.
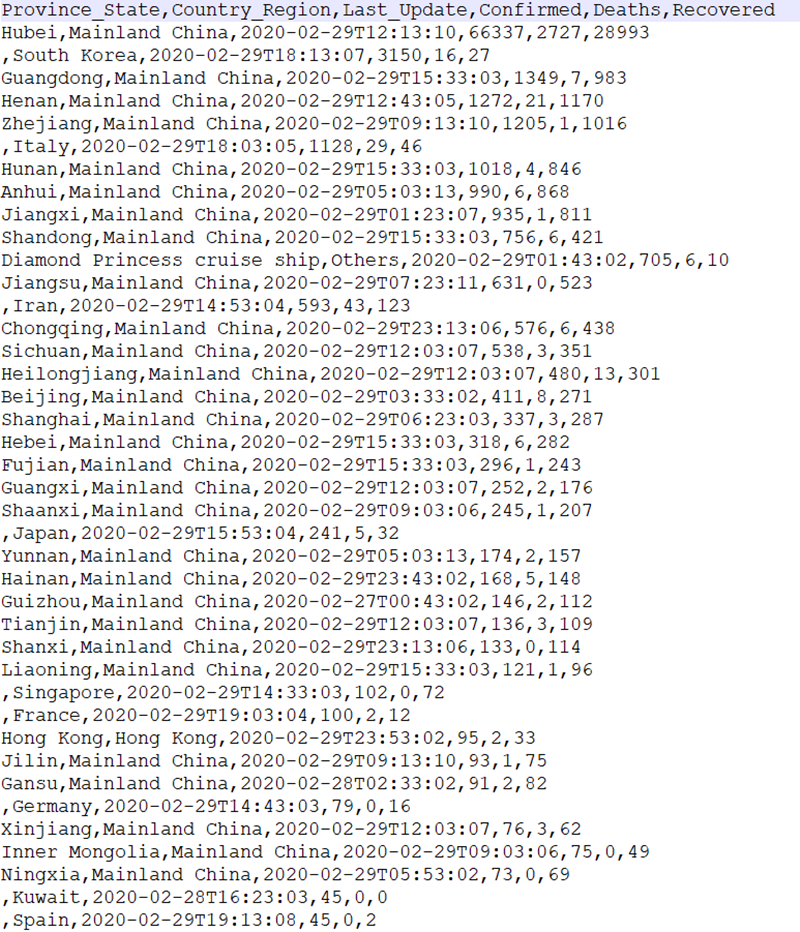
(1) Coronavirus data.
A: We can get a lot of Coronavirus data from Internet, such as: https://github.com/CSSEGISandData/COVID-19
B: We also need to do some data processing to make the data meet the requirements of our use. For example, modify field names so that they do not contain illegal characters, delete empty row. Here is the data after I processed:
https://drive.google.com/open?id=1YHBAziIJTt5rcVcP_REUTJfvR7kCoGKB
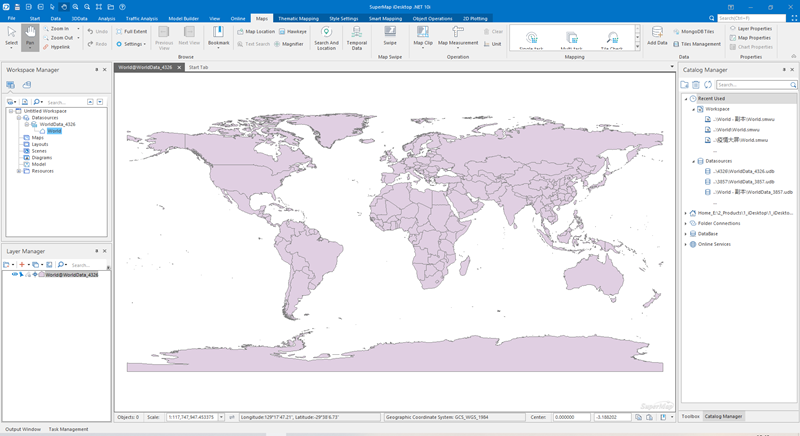
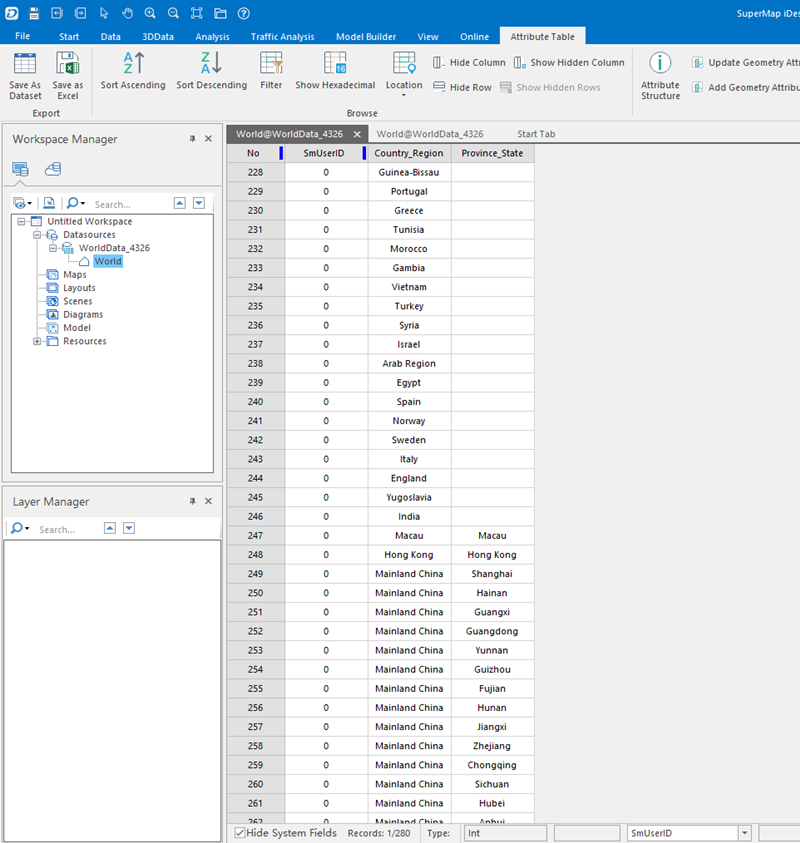
(2) GIS base data.
The Coronavirus data we found only have Country & Region and Provice & State field, there is no coordinates or any spatial information, so we need to prepare a GIS data who has the same name of Country & Region and Provice & State, to map to Coronavirus data for spatial information. I have prepared one like this:
3. Data Visualization
DataViz webapp is built in the SuperMap iportal, which provides professional online mapping capabilities, supports online map creation and multi-user collaborative editing. After the data preparation, we can use DataViz to make map online instead of making map on desktop tools.
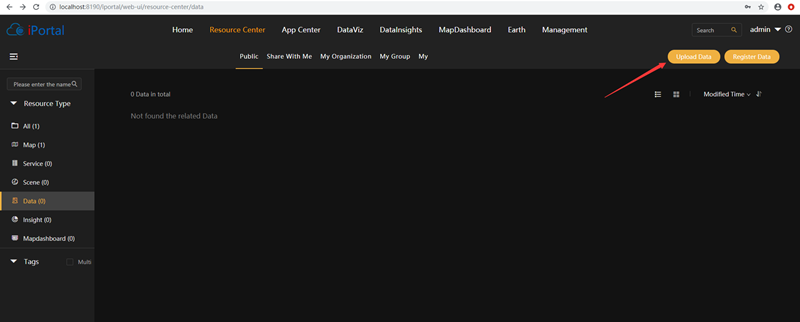
(1) Go to Resource Center, upload GIS data to iPortal.
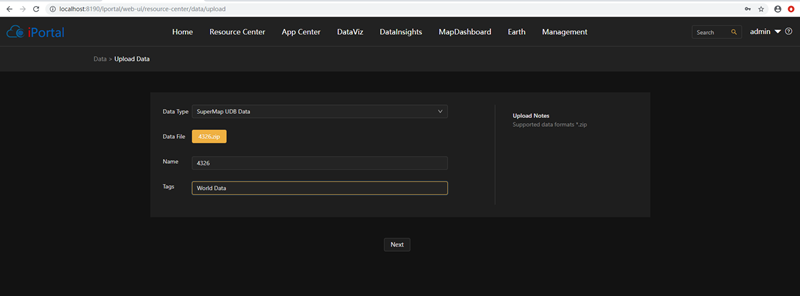
(2) Choose SuperMap UDB Data and select the .zip file which include SuperMap file datasource .udb/.udd.
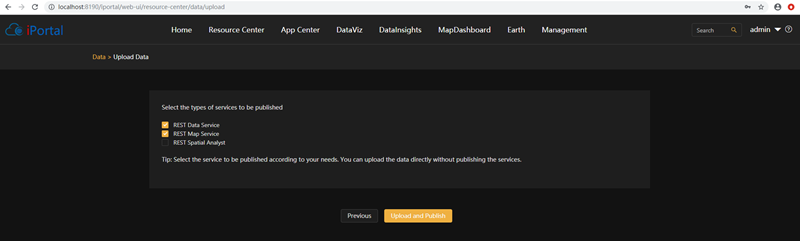
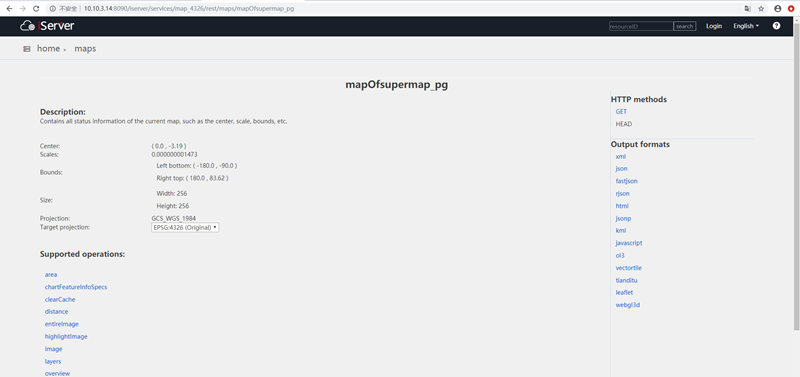
(3) And publish the data as REST Data Service and REST Map Service.
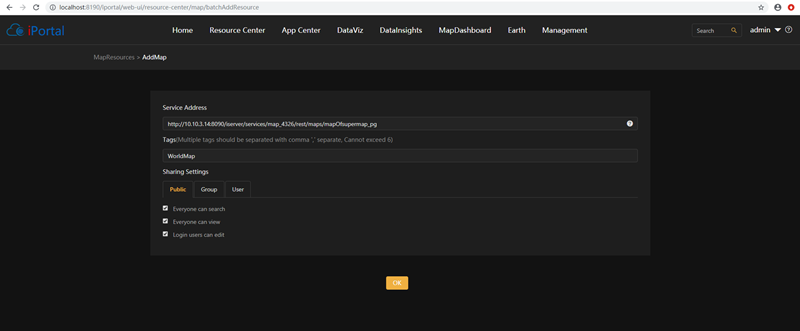
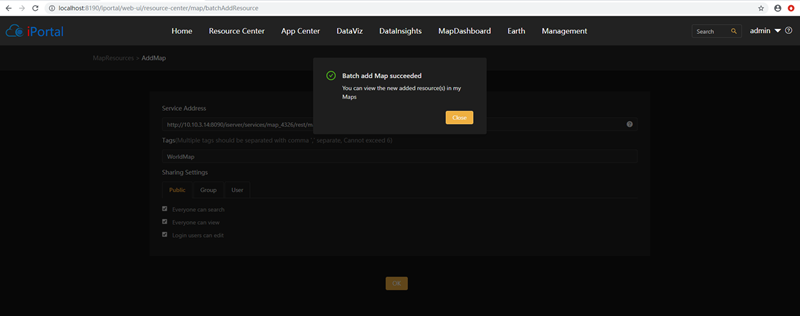
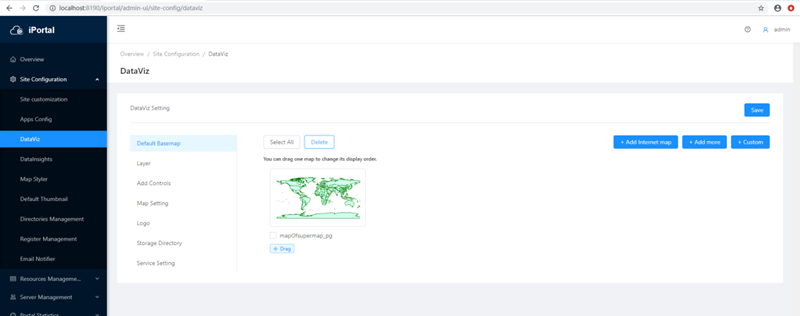
(4) Open the url of map service and add it as a map in iPortal.
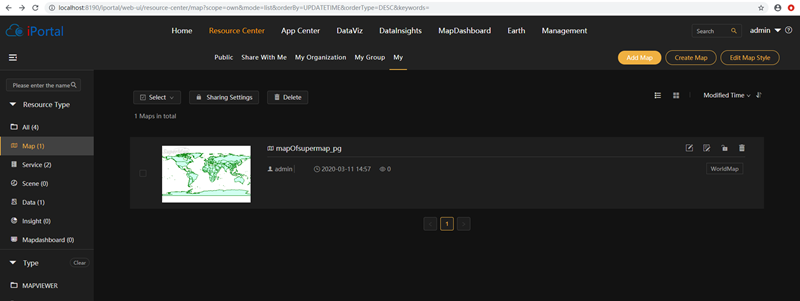
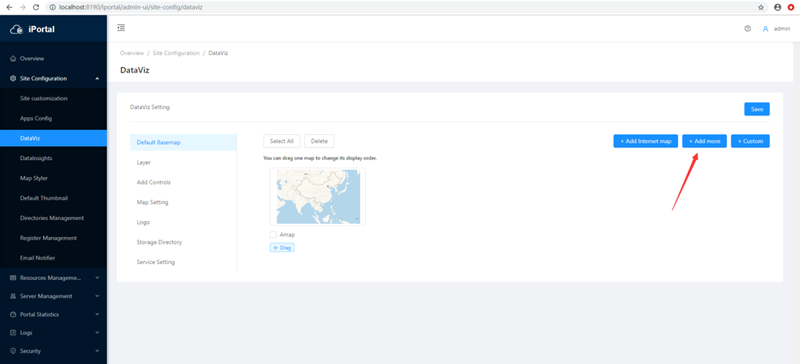
(5) Add this map as basemap of Dataviz in Management page. At the same time we can delete the default Amap from basemap.
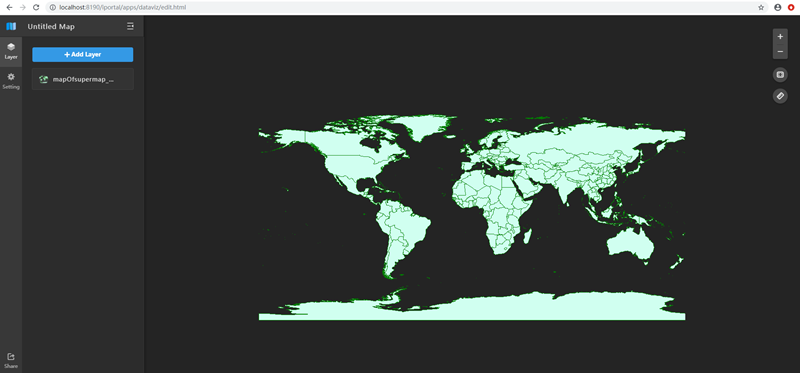
(6) Go to DataViz, then we can see the basemap here.
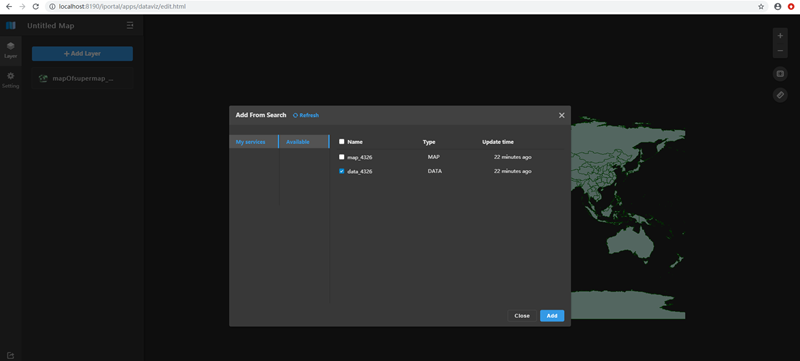
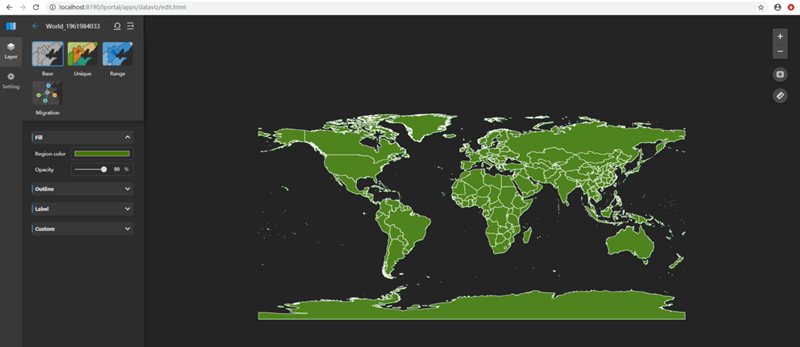
(7) Add layer from search, choose the data service to show all country in a better way.
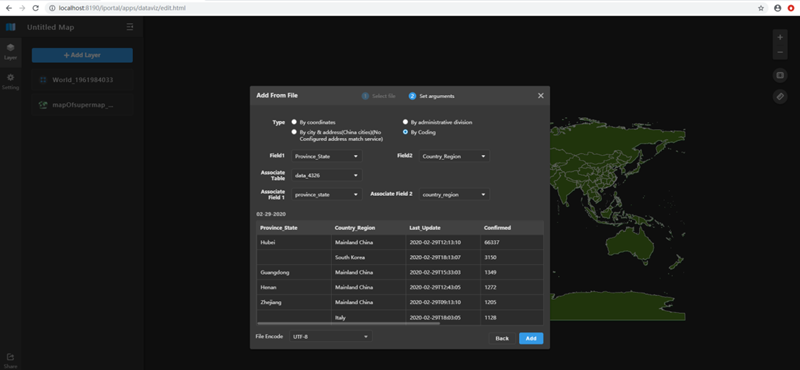
(8) Add layer from file, we need to choose the csv file then based on REST data service to map spatial information (by coding)
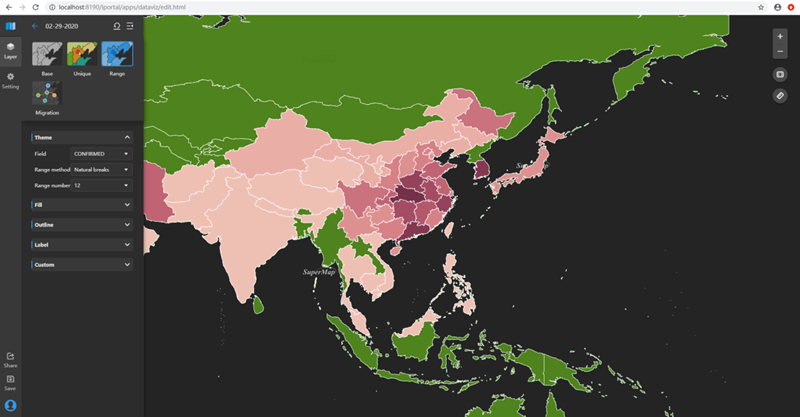
(9) Configure the layer shows in Range map, and set Field as CONFIRMED, set Range method as you want, such as Natural breaks.
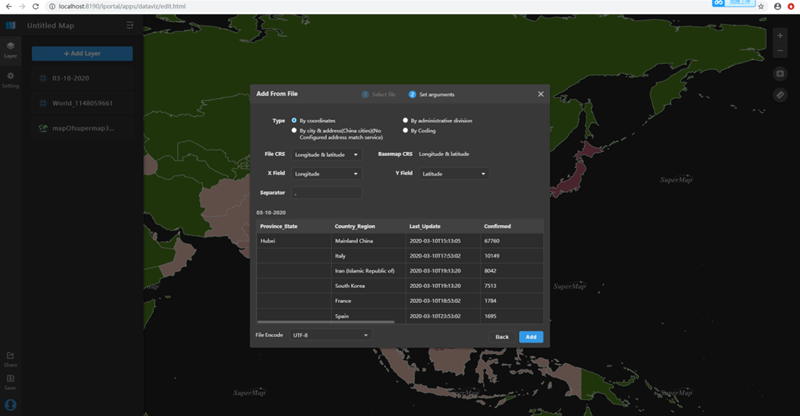
(10) Add layer from file again, then we can choose adding by coordinates.
(11) Then set the type of layer as Rank Symbol, and set theme Field as CONFIRMED, set Range method as Square root segment, set the symbol color as red.
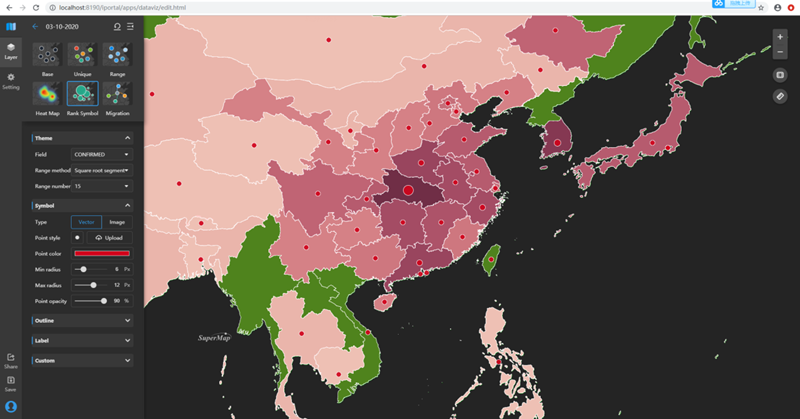
(12) Then set the type of layer as Rank Symbol, and set theme Field as CONFIRMED, set Range method as Square root segment, set the symbol color as red.

4. Make Dashboard
SuperMap iPortal provides the Map Dashboard webapp, which is an online application for making large visualization screens, which can help users easily build map visualization applications through graphical interface and interactive operation. Here I will choose some of components of Web Dashboard to make the dashboard, you can also make it as the style what you want.
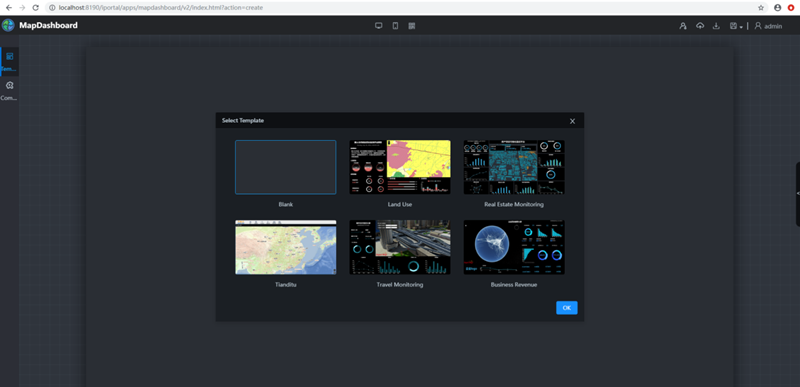
(1) Go to Map Dashboard from iPortal homepage. Then choose blank template.
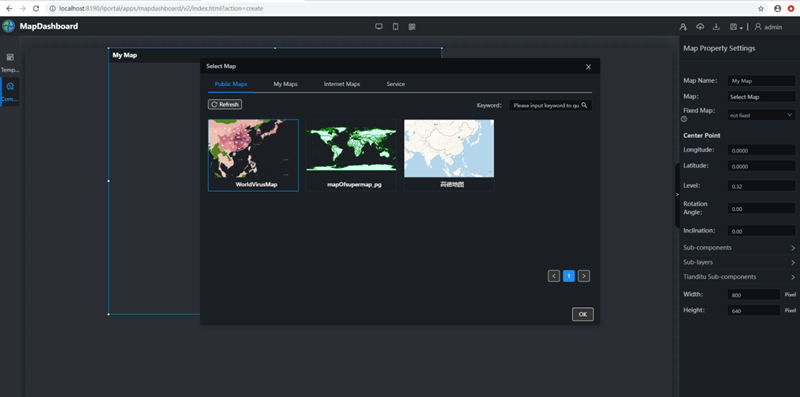
(2) Map component
A: From the left side, drag Map component to main window, then on the right side click “Sleect Map” then choose our WorldVirusMap
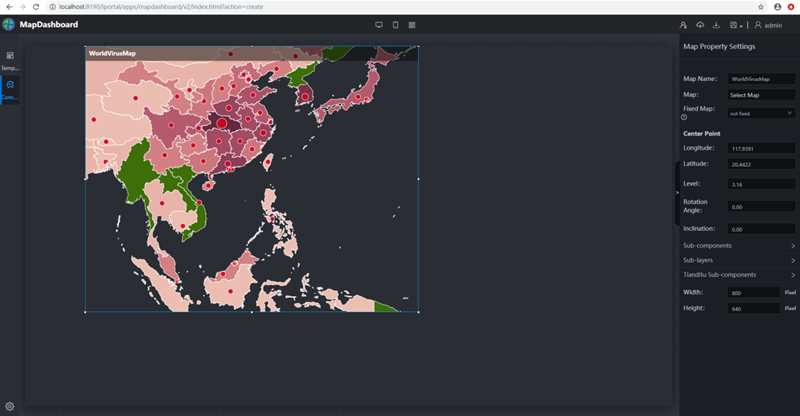
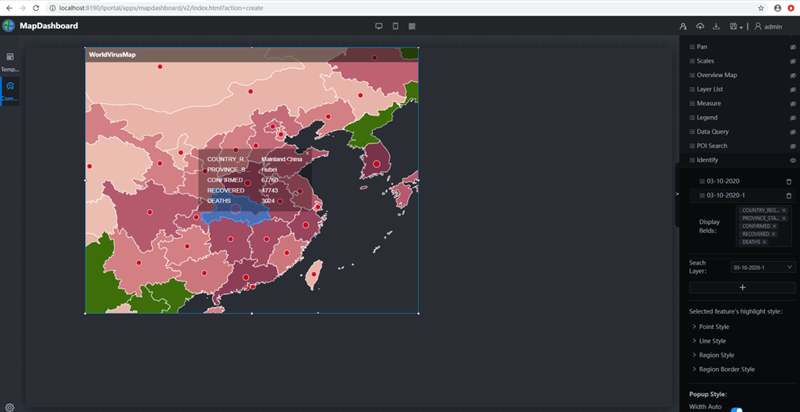
B: Set sub-components of map, choose Identify and set it as visible, then set the layers you want to be clicked.
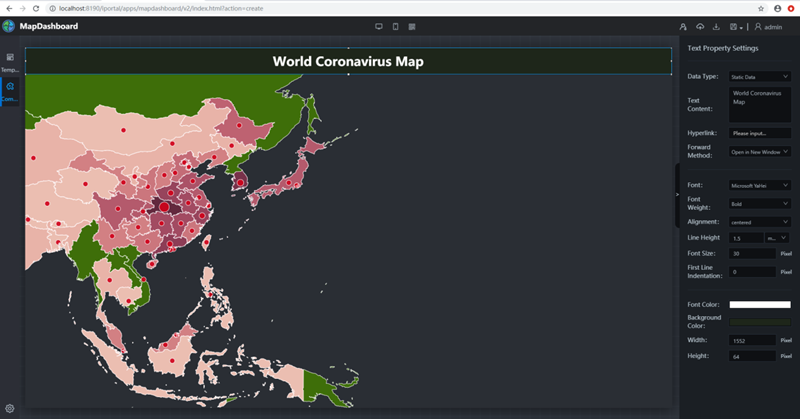
(3) Text component, drag and drop Text component from left side, then modify the content of it.
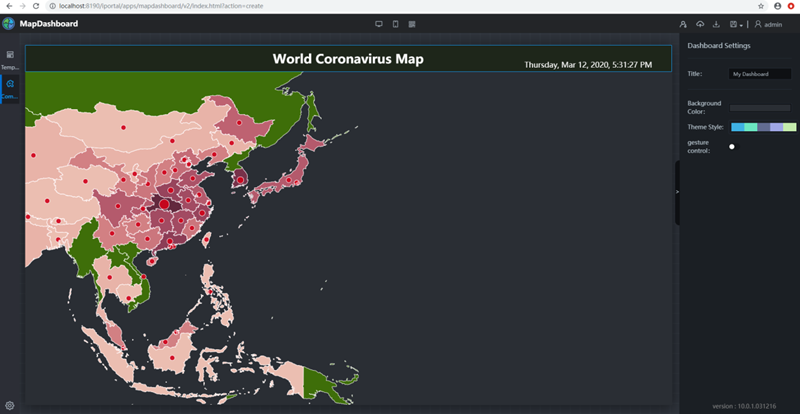
(4) Date and time component, drag and drop date and time component from left side, then set the position and size of it.
(5) Line chart
A: Upload time series data to iPortal.