GTMAP (part of SuperMap) has been committed to the intelligent application software industry for many years. With integration, map perception, quick linkage, smart operation as the core, it has formed a set of smart park solutions with full coverage, high practicability and strong flexibility, serving the management committee, enterprise groups and visitors of the park. In this solution, the economic park centers more on intelligent operation, that is, comprehensive management and overall operation of the park, while the chemical park focuses more on quick linkage, that is, production safety, risk monitoring and management, emergency response, etc.
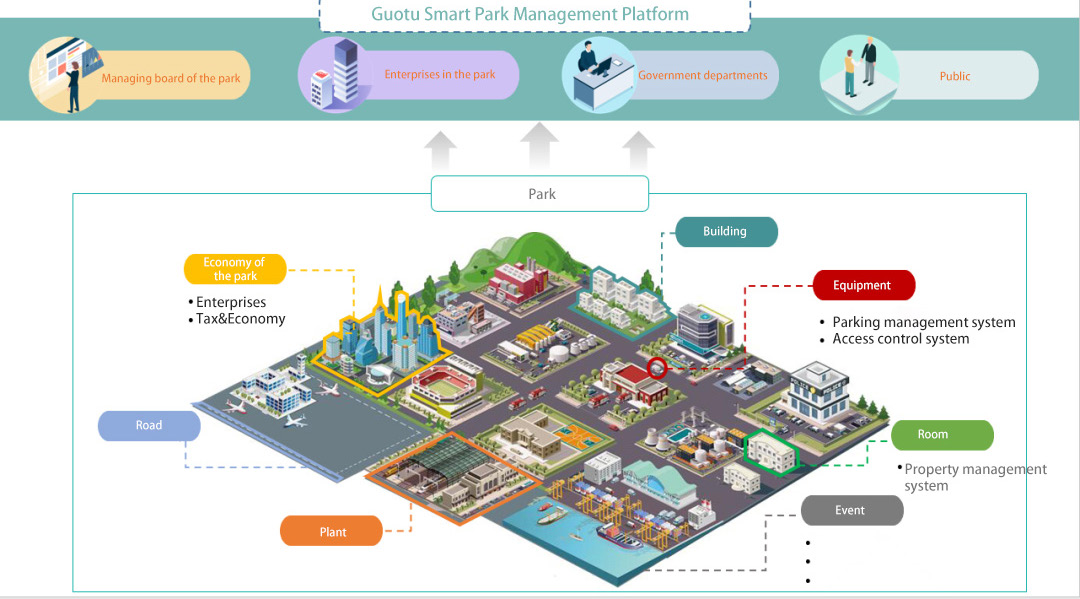
Integration: Park management on “One Map”
There are a lot of data in the process of park operation, such as basic geographic data, special topic data of park operation, dynamic monitoring and perception data, etc. They are scattered in various departments and are collected and exported in isolation from each other. How to break the gap between data and effectively connect these data to serve the operation of the park is a basic problem that the smart park platform must solve. Based on all kinds of existing data and using maps as the carrier, we formulated a unified space-temporal datum. Through data aggregation, sorting and fusion, we finally formed a multi-dimensional unified full-space space-temporal resource pool to get a clear picture of the park’s background. Based on the space-temporal resource pool, the platform manages the park resources as a whole.
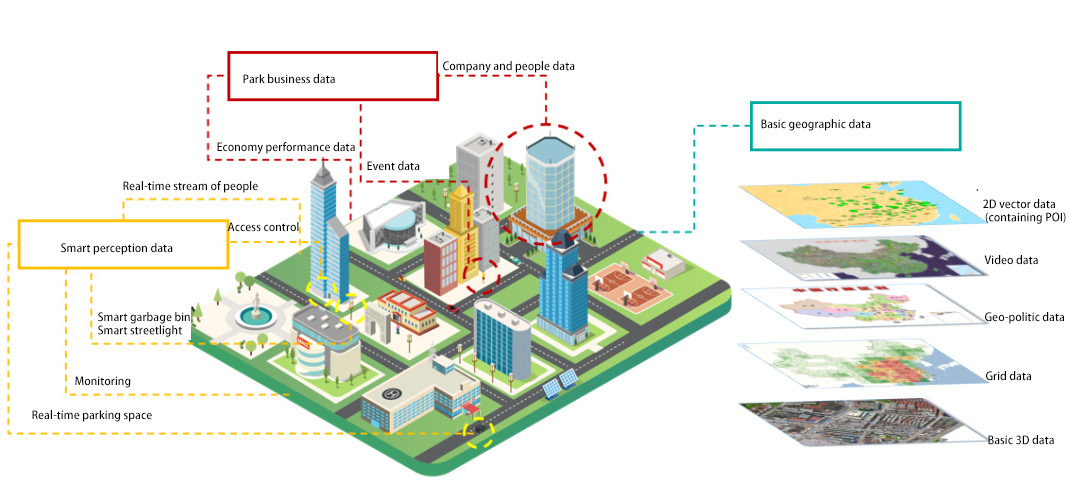
The 2D and 3D scene is the macro expression of the park. It integrates the 2D, 2.5D, and 3d data (stretched model, fine model, oblique photography, laser point cloud, etc.) of the park in the same scene through the 2D and 3D integration technology, to integrate the information of the park, including land, buildings, vehicles, equipment assets, events and other information on the map. It provides data basis for subsequent map perception, quick linkage, and smart operation.
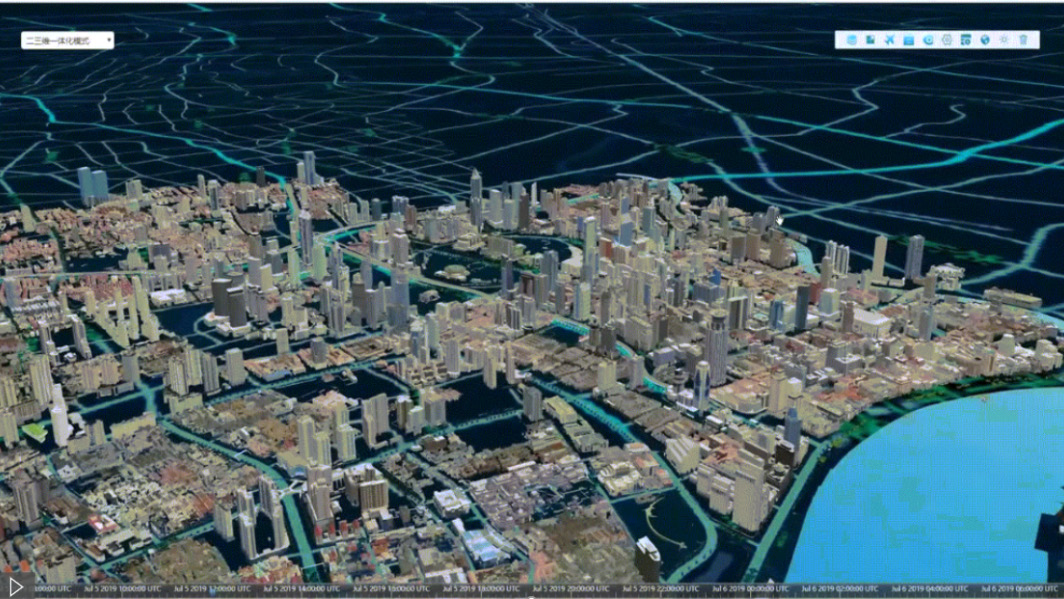
Integrated 2D-3D scenes
The gate and smart exhibition hall of the park can be connected to the 2D&3D integrated large screen to display the basic information and landscape of the park. The operation and control center can also be connected to the geographic dashboard system to monitor events in the park and respond to emergencies quickly.

Geography dashboard scenario
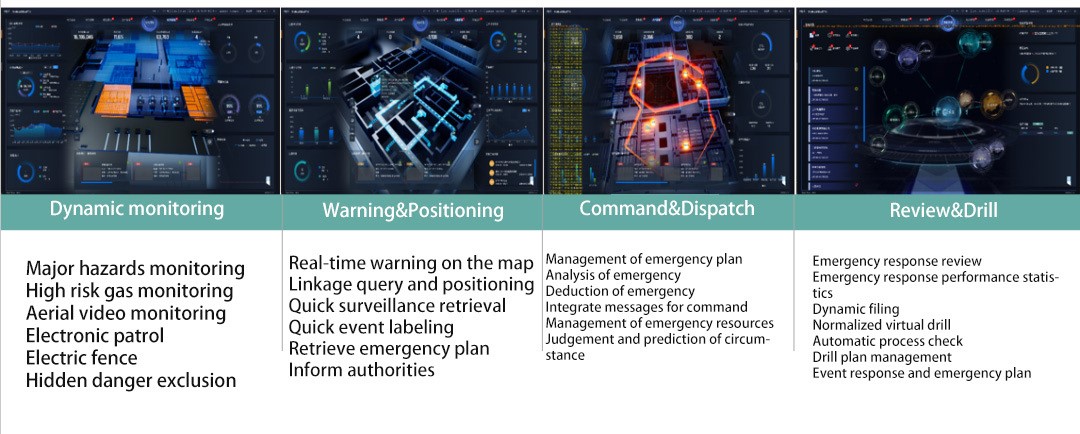
Map perception: Management of smart facilities on the map
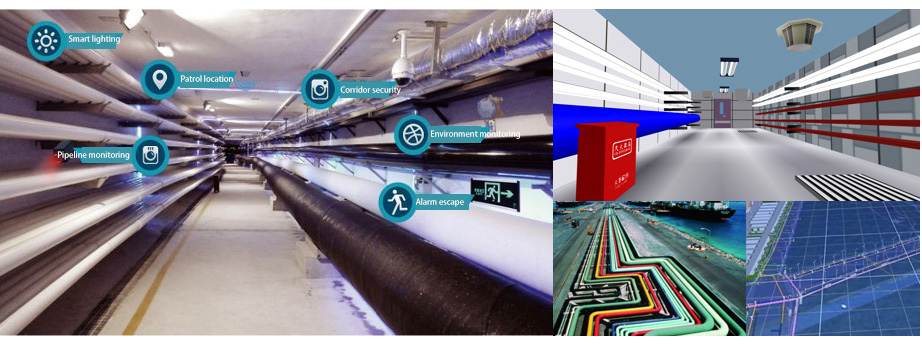
Through the access of various intelligent devices in the park, such as location, device information, and real-time perception data, the location and operation parameters of various sensing devices are marked on the map to quickly perceive the status of the park. The perceived data includes the facilities of the park, the state of the underground pipeline network, access control, personnel tracking, cameras, and other key monitoring data. Smart perception provides more valuable data information for data collision and top-level business applications in smart parks.
Basic perception includes the infrastructure of the park, the state of the underground pipeline network, access control, and personnel tracking.
Application of face recognition, intelligent detection, Internet/Internet of things technology to access smart equipment support the personnel and vehicle access control, security alarm, information query, and other functions of the access control management, to provide support for the safety of the park. The personnel and vehicles entering the park are identified, and the behavior trajectory is constructed within the viewable range of the park probe.
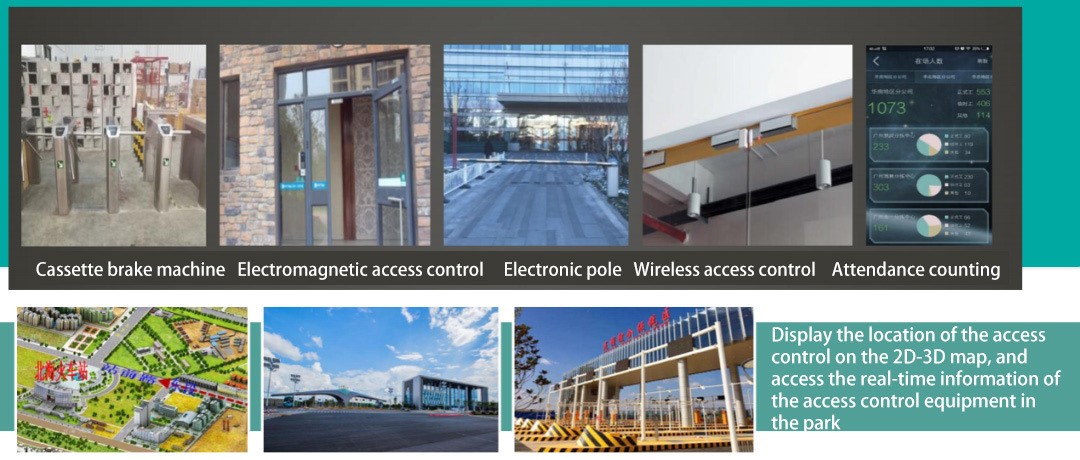
Access control monitoring
Monitor pipeline safety in the pipeline corridor and the status of the pipeline corridor space and auxiliary facilities in real time, timely response to emergencies, such as pressure, temperature changes, automatic alarm message, support remote opening or closing of emergency equipment.
Underground corridor monitoring
For infrastructures such as trash cans, garbage rooms, street lamps, manhole covers, firefighting equipment in the park, the 2D information of infrastructures is associated with the 3D model, and the park facilities management system can be accessed to obtain the operation status, operation ratio, and failure rate of facilities. The real-time status of infrastructure can be viewed through the 2D-3D connection. It can solve the problems of high operation and maintenance costs, poor service experience, and difficult operation and maintenance in traditional parks.
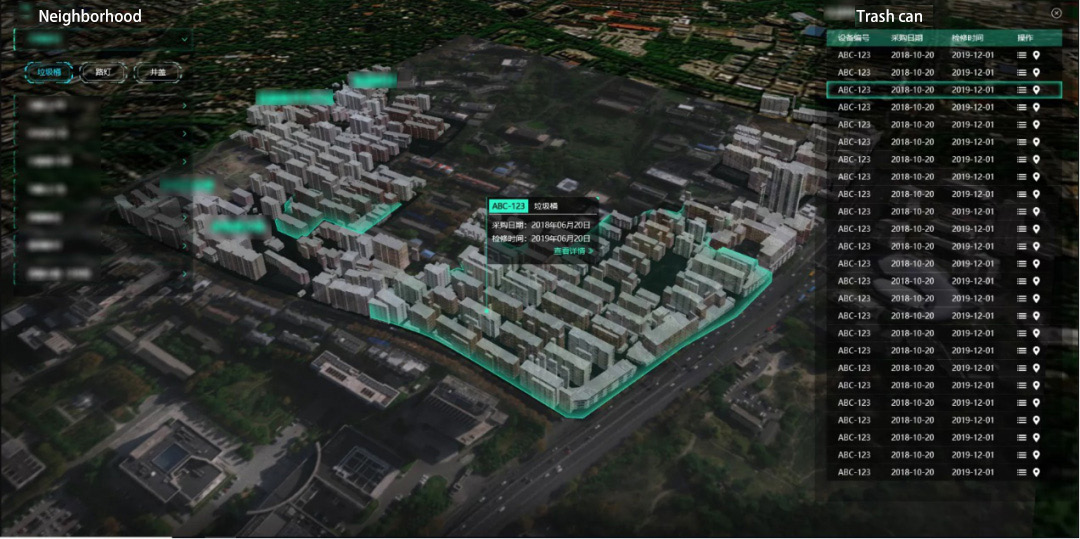
Monitoring of infrastructure
Key monitoring mainly includes three modules: hazard sources, pollution sources, and primary defense and protection, centering on visual presentation and monitoring of main hazard sources, pollution sources, and key protection targets.
Monitoring of high-risk gas: The platform can access the gas monitoring data of the park, and display the monitoring data of the dangerous gas perimeter of key enterprises and the whole gas perimeter of the park. When the monitoring data reaches a critical amount, the early warning function is provided to conduct multi-gas monitoring and early warning, and security monitoring and early warning at the perimeter of key areas.
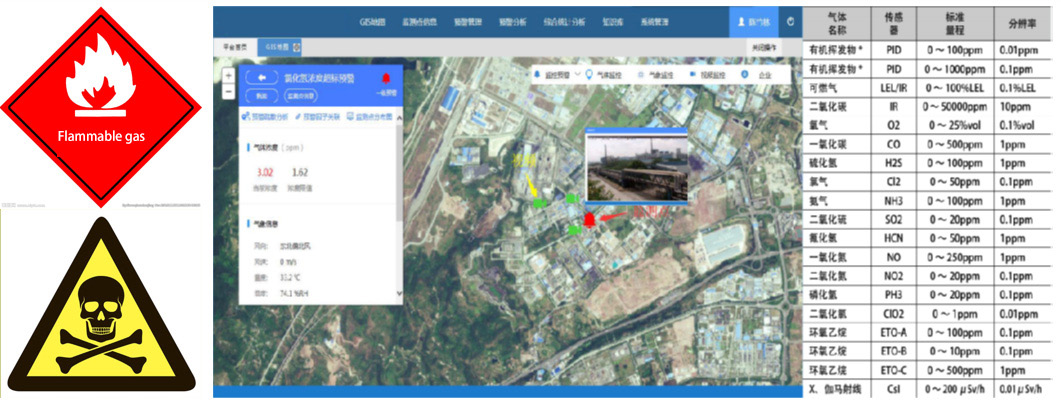
High-risk gas monitoring
Monitoring of vehicles carrying hazardous chemicals: Information review and real-time monitoring can be carried out on hazardous chemicals vehicles entering the park. When the vehicle enters the park, check the vehicle information and driver information. If the information is inconsistent with the pre-reported information, a warning will be given. If the hazardous chemicals vehicle equipped with GPS fails to drive according to the route or stop in the designated parking area in the park, the alarm will be triggered.
Monitoring of major hazards: Hazardous chemical storage facilities, transformers, etc. Support abnormal state alarm, historical state backtracking, which renders it easy to find the cause.
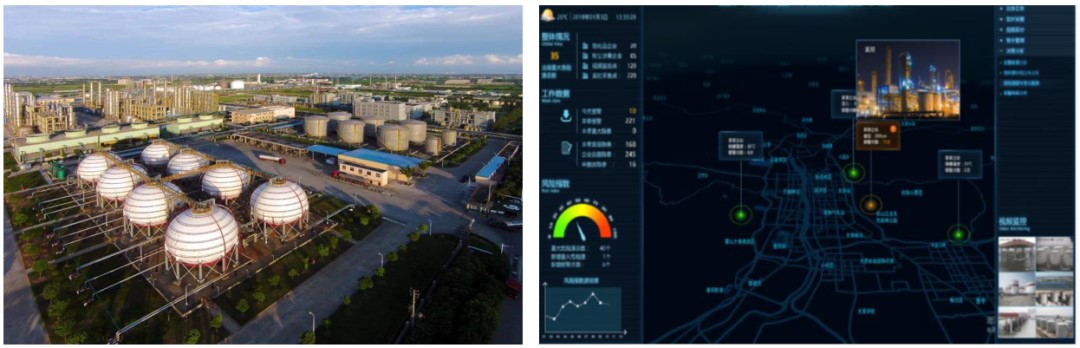
Monitoring of major hazards
As regards video surveillance, the platform visualizes the point position and distribution of cameras to carry out the full-service functions of video surveillance, including list synchronization, real-time preview, video/playback, capture, status display, etc. It supports GPS terminal scan on the map and automatically opens and closes the peripheral camera. It can adjust the map position. In the long view (zoom out), the overall camera data statistics of each area can be displayed. In the close view (zoom in) of the local map, the location information of specific video surveillance points can be viewed and the camera can be turned on.

Video surveillance
At the same time, to reduce the workload of personnel and improve the early warning response capability, the system can use the function of AI video analysis to automatically identify and alarm abnormal phenomena such as flame, smoke and personnel intrusion around the pipe corridor, and remind the personnel on duty to respond immediately.
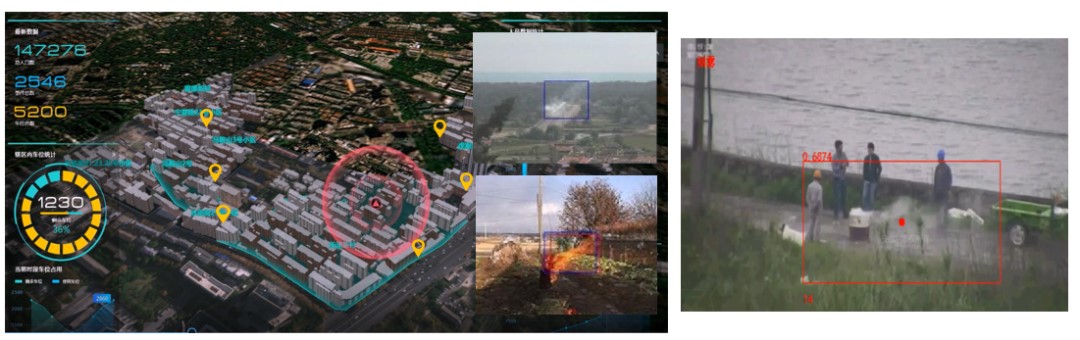
AI smart analysis
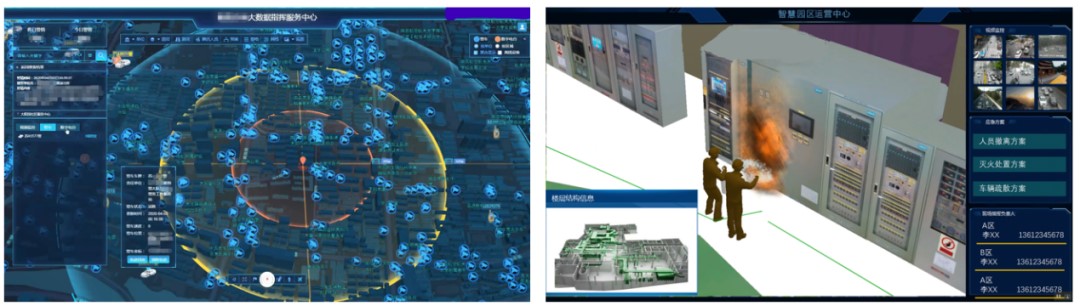
To project the video stream of the monitoring equipment in the outdoor and key indoor scenes of the park into the 3D scene, spatially integrate the video data and 3D scenes data, which can change the traditional model of the map application that can only be displayed statically, and control the overall monitoring area in real time instead, so as to guarantee the security of the park.
Quick linkage: Emergency response to remove hidden dangers
The system can both function in scenarios of “normal monitoring” and “wartime dispatching”. While the former is used for daily communication, park operation monitoring, and management, the latter is in case of a major or comprehensive event after a quick shift.
Event response and emergency plan
Counting and analysis of the risk and hidden danger information of each unit in the park. For enterprises with numerous potential dangers, an inspection order will be generated, and professional personnel will visit to check the relevant equipment according to the hidden danger category, generate a risk hidden danger report, and order rectification.
Create risk files for enterprises in the park for analysis and judgment. Generate enterprise holographic files to record risk hidden dangers, previous warnings, previous accidents etc., in enterprises.
Build an emergency drill management system, render normalized virtual drills and process assessment in typical accident scenarios automatic, support flexible editing and implementation of plans and drill scripts, support the tracking management and evaluation of the whole process of drills, and facilitate sand table emergency drills. A variety of plans are formed at the center of the exercise process, and the plans are visualized. The impact degree of the event and the content of the relevant plan documents are visualized in the plan. When an event occurs, the plan related to the event can be displayed on the map, showing the plan type, the degree of impact of the event, and the plan handling process.
Emergency plan management
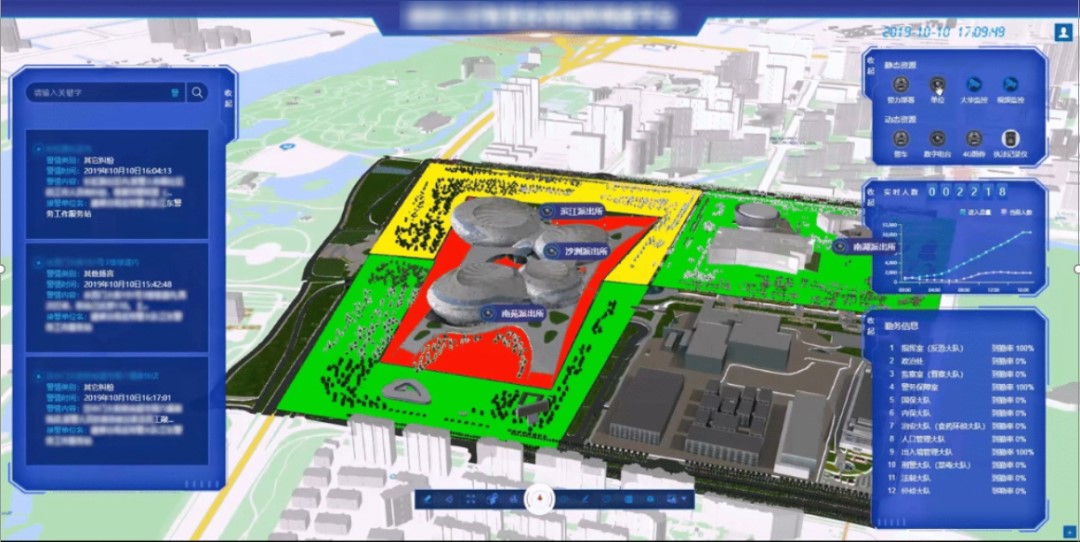
Display warning information, event level, event location, security personnel location, fire facilities location, contingency plan display, and support automatic alarm to the public security, fire alarm, simultaneous scene alarm, and monitoring. It is convenient for managers to understand the progress of the situation, and provide intelligent decision support for park managers to realize the functions of park public security management, security prevention, and emergency public security incident control.
Emergency command visualization
The park rescue command system is the application scenario of “wartime dispatch”. Relying on the planning process, the command center’s handling of emergencies is the core to visualize the whole business process of the emergency handling mode. Relying on the integration of communication dispatching capabilities and the close integration of command and rescue services, the visualization of the entire business process of command and rescue under the emergency handling mode is enabled, and the event task handling nodes are presented in a time-axis manner, so as to quickly connect command and coordinate the handling of rescue in a unified manner.
The disposal system is based on the event disposal process and time tasks, mainly including modules of “event reporting”, “dangerous situation analysis”, “emergency plan”, “on-site disposal” etc.
Smart management: Promote the park’s development
Digitally empower the daily investment operation of the park and the operation of enterprises in the park, and establishes the geographic grid operation analysis of the park’s big data. The platform conducts unified standards, mining, and analysis of data, and park managers will learn the real-time status of park personnel, resources, and events at any time, and comprehensively control the operation of the park. Once emergencies occur, cross-departmental, cross-regional, and cross-system collaboration will be enabled, resources can be dispatched uniformly, and rapid response and disposal can be conducted. The smart operation has vitalized data of the park which is also given to full play.
Graphically manage the usage of geographic information service resources in the park and the access status of various smart devices, perform statistical analysis on the reliability of the signal sources of each device in the park, and provide efficient, comprehensive, and complete one-stop services for the park through the big data chart of the operation, demonstrate the park’s operation condition in the portal or operation analysis module.
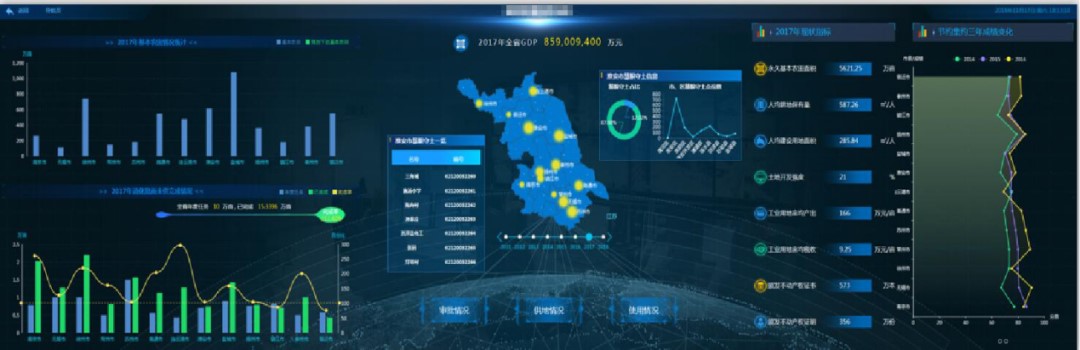
Park’s operation big data
Analyze and evaluate real estate assets such as park land, factories, and buildings, find out the assets of the park, analyze the efficiency of land use, and guide the optimization of park land use and the planning of industrial land use in the new area.
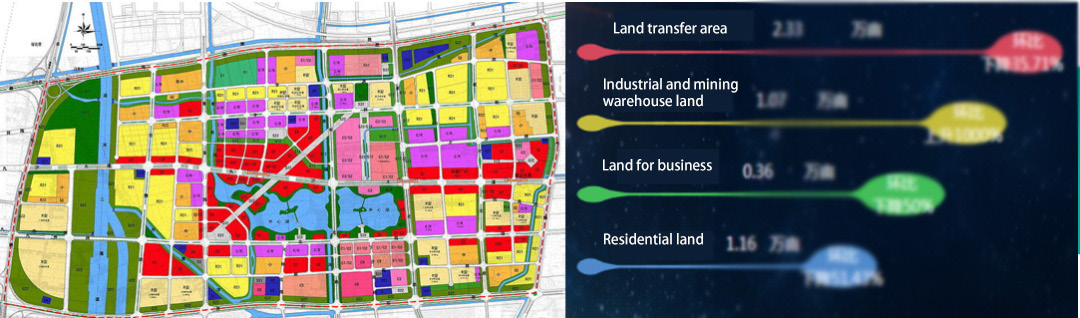
Feature on land assets in the park
According to the economic benefits and tax information of enterprises and production units in the park, the efficient industries and high-contribution economic models in the park are analyzed, which is convenient for decision-making reference for the park's sustainable development of excellent industries and production re-expansion.
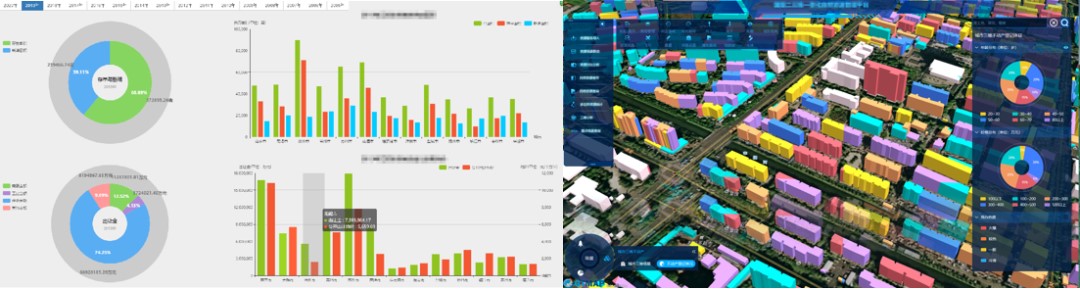
Feature on park’s economic taxation
Efficient energy management in the park is an important support for the operation and service of the park. Energy such as water, electricity, and gas need to be managed. The consumption of various energy sources, pea