>First Prize Winner of Application Analysis Group in the 19th SuperMap GIS Contest
Author: Chen Qihang, Cheng Junrong, Liu Yujing, Yin Zhaoxin
Instructor: He Zhenfang, Xiao Yan
School: Liaocheng University
Requirements
Ranwu Scenic Area is located in Basu County in eastern Tibet and is famous for the Ranwu Lake. It covers an area of 22 square kilometers and the lake is 3,850 meters above sea level. Its beautiful scenes have attracted many visitors from all over the world and also pose a challenge for resource exploitation.
Based on SuperMap GIS 10i(2020), combing GIS and RS technology, this research carries out tourism spatial planning and design based on investigation and analysis of data, expecting to find a new way of development, maintaining a balance between ecological protection and construction in Ranwu, which can “maximize the protection of nature and make the best use of resources” to serve the goal of sustainable development of scenic spots.
Analysis Process
Ecological vulnerability assessment
The data were imported into SPSS, and the grid was standardized to select the indicators. Then, to calculate the eigenvalue and eigenvector of the correlation coefficient matrix R, select the 3 principal components with cumulative contribution rate greater than 85% as the calculation indicators and determine their evaluation index grade to complete the principal component analysis. According to the contribution rate of the first three principal components, the weight of principal components 1-3 was calculated by AHP in Excel software and passed the consistency test. Finally, a mathematical model of ecological environmental vulnerability assessment was established to calculate the vulnerability index distribution of each pixel: the EVI index calculated was imported into SuperMap GIS 10i(2020) for attribute table assignment, re-classification, map visualization, and extraction of the appropriate research area.
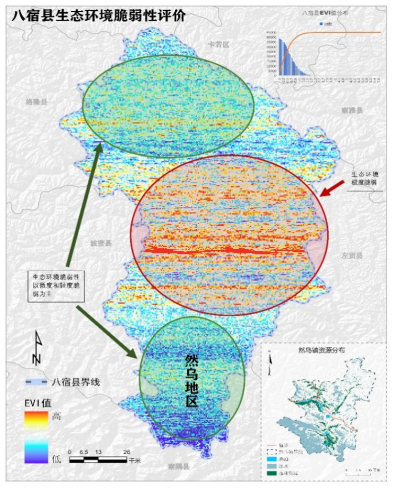
Ecological vulnerability assessment in Batu County
Analysis of avalanche ecological safety zone
Firstly, the risk area of avalanche formation is estimated by the formula. In this model, Av is the calculated value of the potential avalanche. Al is the altitude classification factor; Fy is plane curvature; S is slope; Rg is the type of land cover. In SuperMap GIS 10i(2020), each factor in the formula was reclassified and assigned values, and the range of avalanche formation risk area was estimated according to the geographical calculation results. It calculated the avalanche pass and accretion wind risk areas, the movement direction with the “flow analysis” function of the hydrological model in SuperMap GIS10i(2020), and the avalanche movement range by using the α-β model. An avalanche pass and accumulation risk buffer is created for the scope element. Finally, the results of the high avalanche risk forming area, avalanche passing area, and accumulation area were superimposed to form the avalanche ecological safety zone.
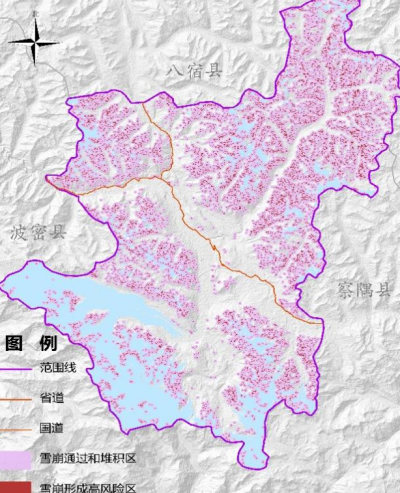
Analysis of avalanche ecological safety zone in Basu County
Analysis of lake flooding ecological safety zone
Lake expansion was regarded as a spatial expansion behavior, and the lake capacity and area after future inundation were calculated based on historical image changes. In the environment of SuperMap GIS 10i(2020), the potential inundation area was delineated by referring to contour lines around the lake.
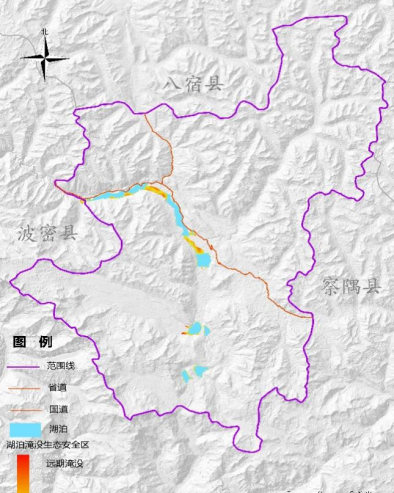
Analysis of lake flooding ecological safety zone in Basu County
Analysis of wetland and swamp ecological safety zone
After DEM data was imported, with the pseudo depression filling tool, reference values were filled in to preprocess the data until the successful filling, then flow direction analysis was carried out, and flow data were obtained by calculating sink volume tool. The threshold value was set to 7,500 to extract the Ranwu river network, and then the Ranwu wetland grid extracted from the remote sensing image was added. The grid operation tool is used to calculate the wetland ecological safety zone.
Analysis of lake and glacier ecological safety zone
By using remote sensing image recognition technology and combining the glacier and water ranges from the 30-meter fine surface coverage data of Tibet in 2020, the lake and glacier ranges of the Tibetan Plateau are extracted from SuperMap GIS 10i(2020) :
Delimit the protection scope of lakes and glaciers around the water body, and create protection buffer zones for the elements of the two safety areas, with the buffer zone distance set at 120 meters. The lake and glacier area and its buffer zone are combined to form the lake and glacier ecological safety zone.
Analysis of forest vegetation ecological safety zone
Combined with the actual situation of Ranwu Scenic Spot, large forest vegetation patches with high coverage levels are taken as protection objects. Based on the forest data of the 30-meter fine surface coverage data of Tibet in 2020 in SuperMap GIS 10i(2020). The enhanced vegetation index EVI, which is commonly used in the field of surveying, mapping and remote sensing, was used as the quantitative evaluation index to select the forest vegetation ecological safety zone, and the EVI data for the recent four seasons were extracted for comprehensive comparison to improve the accuracy of data.
Ecological corridor evaluation
According to the commonly used source resistance surface method for ecological corridor construction, reclassification and cost assignment were carried out in combination with the five ecological safety zone areas. The data on the cost resistance surface were obtained by embedding the new raster tool. Finally, the range of the ecological corridor was obtained by using the cost distance tool.
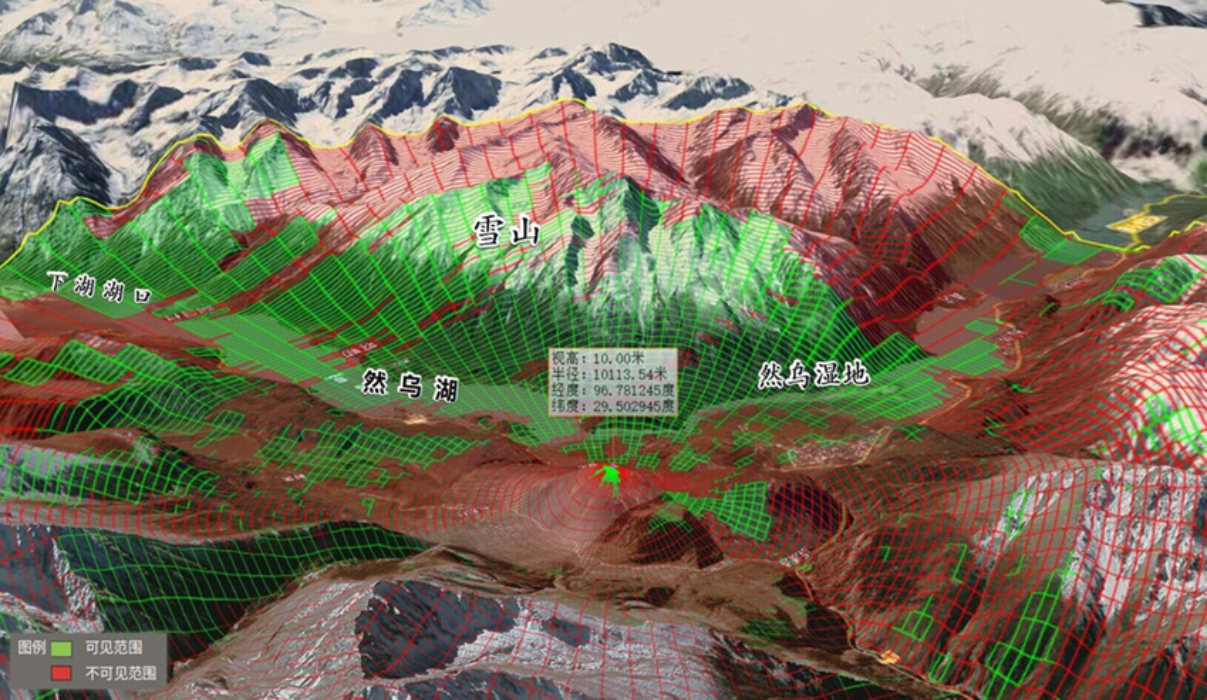
Best viewpoint evaluation
Based on the corridor obtained in the above step, the line turning point tool was used to get the potential scenic spots. The view area of each selected scenic spot was extracted by using the view area analysis tool in SuperMap GIS 10i(2020), and the view area of each selected scenic spot was superimposed with scenic spots such as lakes and glaciers to obtain the intersection. Finally, the 32 plane elements were combined into one by using the merging tool. The value of the SmArea field in the property table is the observation area corresponding to all primary observation sites. Import the attribute sheet of the merged elements obtained in the previous step into Excel for quantification, and finally select eight high-quality scenic spots. The view range of eight high-quality scenic spots is analyzed one by one, and finally, the best view of the Ranwu scenic spot is obtained.
Analysis of avalanche ecological safety zone in Basu County

Analysis of lake inundation ecological safety zone in Basu County
Comments from instructors
This work is based on GIS, RS and SRP (including ecological sensitivity-ecological resilience-ecological pressure) model in ecology. Based on investigation and analysis of data on spatial planning and design, it builds the scenic spot and planning model for the evaluation of space, and maintain a balance between ecological protection and construction in Ranwu, which can “maximize the protection of nature and make the best use of resources” to serve the goal of sustainable development of scenic spots. The team’s analysis of the problem is relatively complete, considering various influencing factors, and the data are from various statistical websites, which ensures the accuracy of the analysis results to a certain extent. In the analysis process, the team members had a clear division of labor and actively communicated with each other. They applied the knowledge they learned in class into practice, improved their ability to analyze and solve problems, and demonstrated their team spirit. Through this competition, they also have a deeper understanding of SuperMap software and are more familiar with the use of various editing and analysis tools. The final analysis results can also be a reference for similar scenic spots.