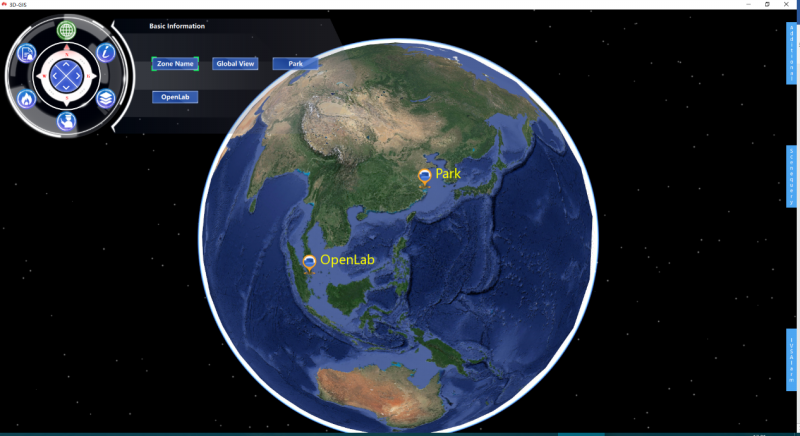
VR Global Vision Corp (VRGV) and SuperMap jointly developed a Digital Sand Table System and Smart Park Management System for Nanchong National Agricultural Science Park to enhance the capabilities of managing the science park. Now, we will explore how the two systems are developed based on SuperMap GIS technology and how they function in facilitating the management.
“Agricultural Science and Technology Park” Digital Sand Table System
Digital Sand Table (DSB) is a digital representation of a traditional physical sand table. It features multi-dimensional terrain simulation, intelligent dynamic display, overall function control, comprehensive deduction training, easy operation, and wide application.
A modern agricultural digital sand table is the digital representation of a traditional physical sand table. It features multi-dimensional terrain simulation, zoning 3D display, basic information data display, multi-perspective roaming, planning assistant IoT data integration.
The modern agricultural digital sand table technology is based on the multi-dimensional information theory with the unique core engine of VR processing and GIS, 3D and VR (Virtual Reality) integration technology. It achieves a breakthrough from plane layout to spatial planning, from a static display to dynamic simulation, from one-direction guidance to multi-direction interaction, and from abstract description to intuitive deduction. It provides users with a convenient and interactive system for regional agricultural industry development planning, park management, big data statistics of agricultural products, and agricultural production and management. It mainly includes the following aspects:
1. Geographic Information Integration
The system strengthens the application of various basic information, such as geographic information, remote sensing image and current agricultural resources information. From the traditional simple reference to absolute support, it improves the scientific accuracy of the planning process and results.
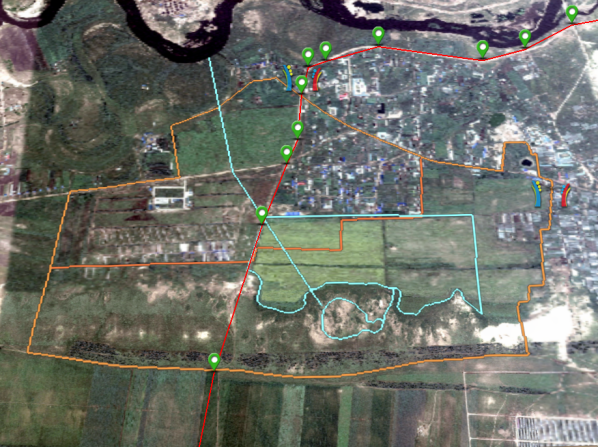
Take the vector data collected or investigated from administrative boundaries, type of land use, roads, and water conservancy as an example: By collecting data, the storage, processing, analysis, retrieval and display of spatial data can be conducted to provide a beneficial platform for decision-making, recording and information exchange in agricultural regional planning.
It integrates land resource data, crop yield data, soil and water resource data as well as multi-conditional data statistics, queries, filtering, etc.

2. 3D restoration of topography and geomorphology in the core area
To restore the image maps of the core area at 1:2000 and 1:200 with different precision, and to restore the real terrain status by combining the terrain height. It can visually and stereoscopically display the images of mountains, rivers, towns and traffic.
3. Integration of land properties
Query, statistics, and analysis application support for agricultural basic information data, with arbitrary overlay and mixed display. It provides favorable geographic data support in the planning system.
4. The integration of administrative information
Based on the national image of terrains, the system can superimpose the vector data of city boundaries.
5. The integration of vector information of water, electricity and road network
The importing of the vector data and the superimposing of city traffic hubs and rivers can reflect the power and water environment of the park, as well as interpret the geographical advantages of the park.
6. The integration of IoT data and controlling
A part of the typical agricultural IoT monitoring signal of the agricultural IoT application project being carried out in the park is introduced into the digital sandbox system, such as the monitoring video, temperature, humidity, etc. in the shed, which is visualized in the system for visual management and performance, thus forming a demonstration of the typical application of IoT.
In the digital sand table system, clicking on the "Associated Network" module in the task menu, the digital sand table will display the IoT “monitoring” and “controlling” operation panel. Monitoring: data collection and analysis of soil, moisture, air, light, etc. Controlling: remote operations of shading, watering, video monitoring, etc. It is a combination of a digital sand table and IoT system as well as 2D data and 3D spatial construction and real-time monitoring data.
The platform applies the virtual simulation technology and multi-source data fusion technology, which makes the traditional planning and construction change from 2D to 3D and static display to dynamic simulation. At the same time, a large number of industrial data, administrative information, basic natural data and other resources are distributed on the 3D terrain according to the actual situation. It supports multi-scene segmentation and dynamic loading and integrates GIS layer data, basic information data, 3D scene model data and IoT detection data.
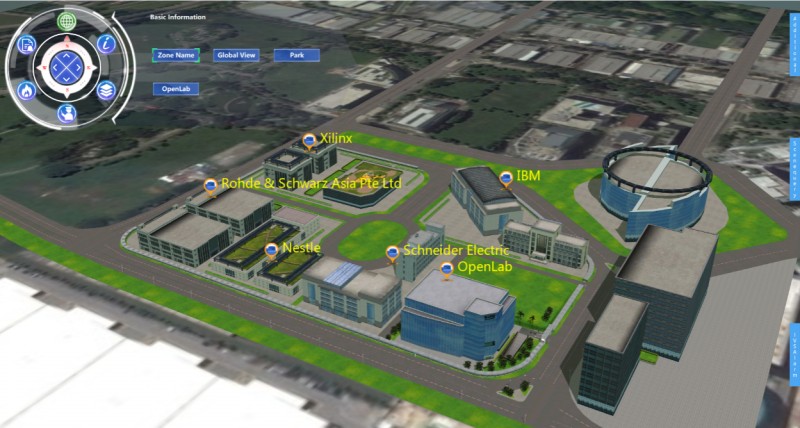
“Agricultural Science and Technology Park” Smart Park Management System
In terms of park management, there are many security and property management subsystems in each park that were built at different times, which triggers operational inefficiency, security hazards, and high energy consumption.
The park project is targeted at practical problems, resolving difficulties in security management, operation efficiency, energy-saving and emission reduction and personnel experience in the park, and establishing the operation management system of the whole park. Based on the innovation of New ICT technology, it supports the management which is visual, green and intelligent. The park carries various service data through a unified GIS platform to support the construction of smart services in each park.
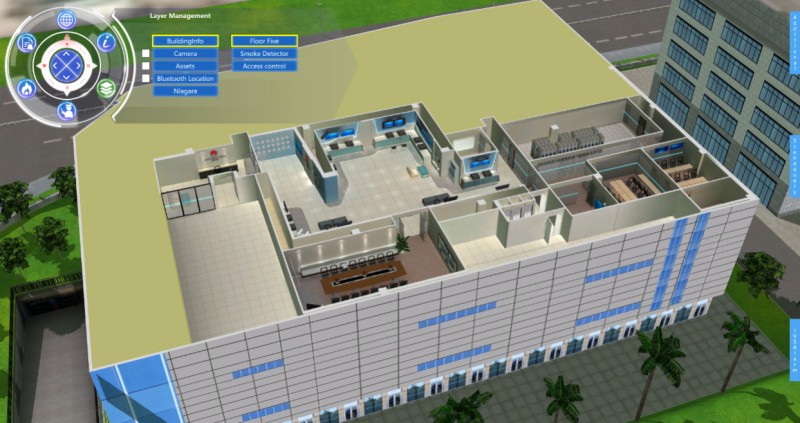
It is the three-dimensional space management involving both the management of the inner field of the building and the management of the outer field of the park.
In this three-dimensional space, numerous relatively static data and dynamically changing data are managed, including the basic building information of the park, the basic BIM information of facilities such as water and electricity pipeline networks, BA building control information such as air conditioning, plumbing and fire protection, property information such as assets, personnel and vehicle management, information on the safe operation status of the park, ICT infrastructure distribution and usage information, and performance data information of the park operation, etc. The information is carried by different subsystems respectively. For park managers, how to achieve decentralized control and centralized management of each subsystem, and have a comprehensive understanding and perception of the overall operation of the park, so as to render it: observable (IoT perception), visible, manageable (manage the system or people), traceable is very important.
To achieve:
1. Visible management
Build the GIS platform of the park to provide GIS service for the park management system to achieve the visualization management of the operation.
2. Improvement in staff service quality and efficiency
2.1 Navigation, public resources finding such as meeting rooms, office cubicles, printers for employees.
2.2 Location seeking such as buildings, fire points, accidents sites and navigation for security personnel.